
The broad market indexes have been under pressure lately, but the housing sector is a notable exception, with the iShares U.S. Home Construction ETF (ITB) gaining a vigorous 35% over the past year. Recent performance does not guarantee future returns, however, the iShares U.S. Home Construction ETF is being driven by solid fundamentals and strong momentum in the middle term.
Solid Fundamentals
Historically low-interest rates are a major tailwind for home construction companies. The business model requires lots of capital, so cheaply available capital makes these companies more profitable. Even more important, low mortgage rates make houses more affordable, which is a key demand driver for the sector.
(Click on image to enlarge)
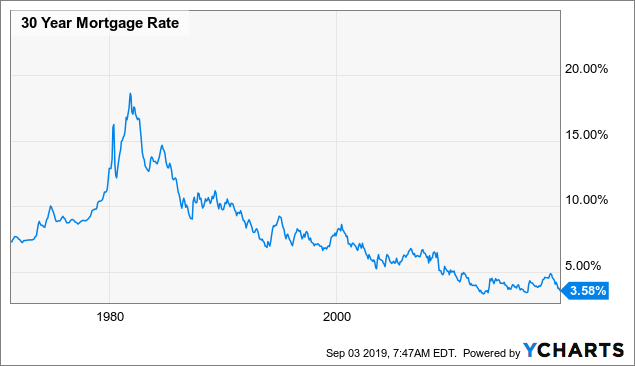
Data by YCharts
Looking at metrics such as new single-family houses sold, housing starts, and building permits, there has been some volatility in recent months, but the data over the long term is looking mostly benign.
(Click on image to enlarge)
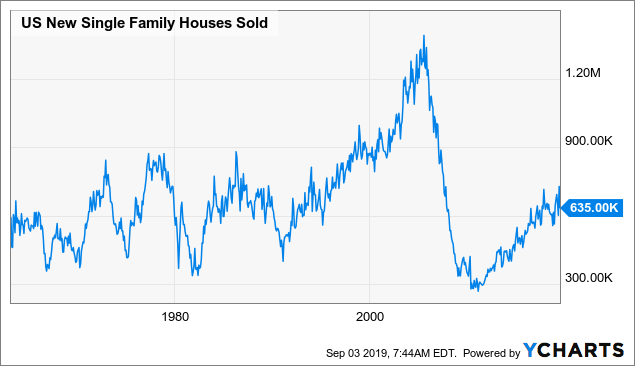
Data by YCharts
(Click on image to enlarge)
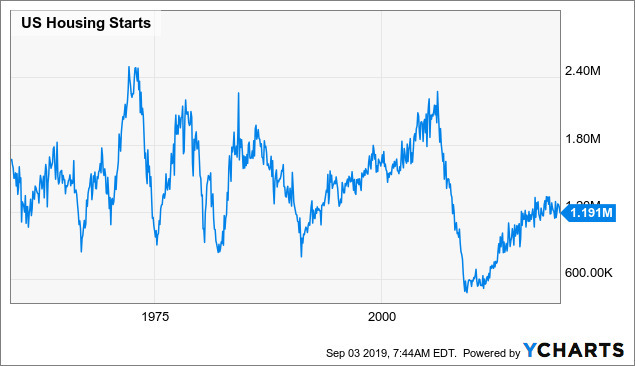
Data by YCharts
(Click on image to enlarge)
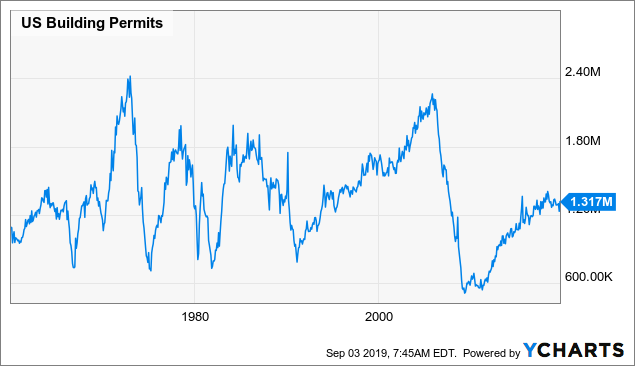
Data by YCharts
ITB has a fairly concentrated portfolio. The top 10 names in the portfolio account for almost 65% of assets, those companies are: DR Horton (DHI), Lennar (LEN), NVR (NVR), Pulte (PHM), Sherwin-Williams (SHW), Home Depot (HD), Lowe's (LOW), Toll Brothers (TOL), Masco (MAS), and TopBuild (BLD).
(Click on image to enlarge)
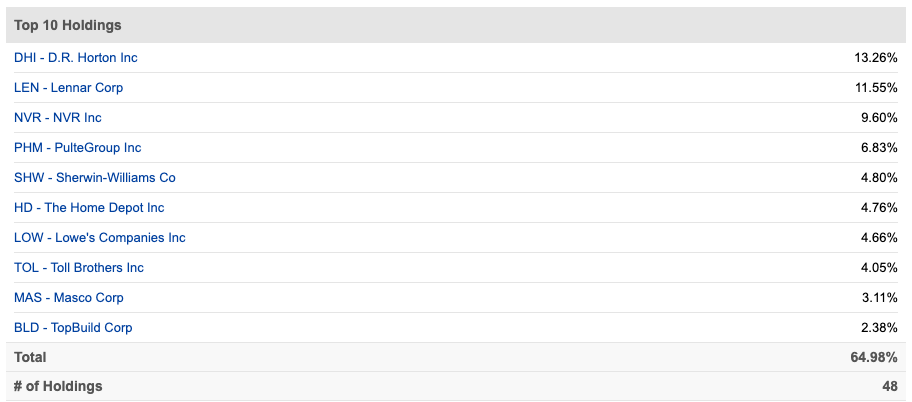
Source: Seeking Alpha Essential
Since the ITB portfolio is highly concentrated, we can take a look at the main positions in such a portfolio from a quantitative multi-factor approach. After all, future returns for the iShares U.S. Home Construction ETF will depend on the future returns that the companies in the portfolio can generate.
The PowerFactors system is a quantitative algorithm that ranks companies in a particular universe based on numerical return drivers, such as financial quality, valuation, fundamental momentum, and relative strength.
The main strategy behind the algorithm is actually quite simple, the PowerFactors system is focused on good businesses (quality) for a reasonable price (valuation) when the company is doing well (fundamental momentum) and the stock is outperforming (relative strength).
(Click on image to enlarge)
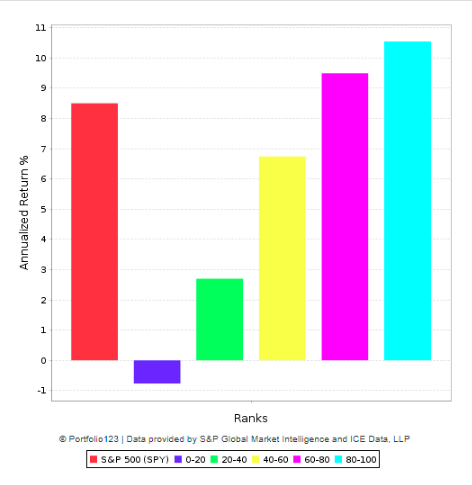
Data from S&P Global via Portfolio123
The backtested performance numbers show that companies with high PowerFactors rankings tend to deliver superior returns in the long term, and the numbers look good for the top 10 positions in ITB.
The table below shows the PowerFactors ranking and the ranking values for the four key components in the ranking system - quality, value, fundamental momentum, and relative strength - for the largest 10 positions in the iShares U.S. Home Construction ETF.
(Click on image to enlarge)
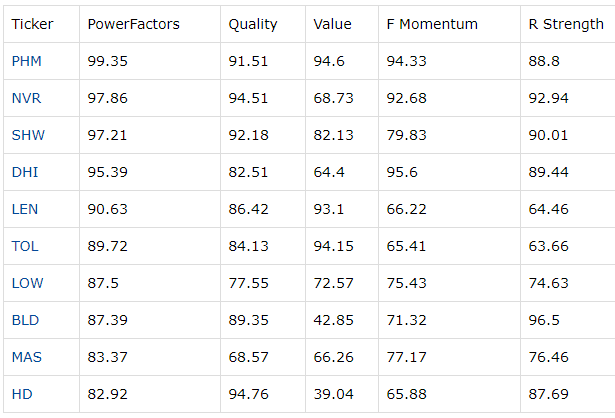
All of the top 10 positions in the portfolio have PowerFactors rankings above 80. In other words, the 10 companies are in the top 20% of companies in the US market based on a combination of quantitative return drivers. Taking a look at the main stocks in the portfolio, the bottom-up fundamental picture looks more than solid.
On The Right Side Of Momentum
The iShares U.S. Home Construction is in a strong uptrend, and it has substantially outperformed the S&P 500 in the past six months. Past performance does not guarantee future returns, but momentum is a pervasive force, which means that sectors and industries that are outperforming the market tend to continue doing so more often than not.
(Click on image to enlarge)
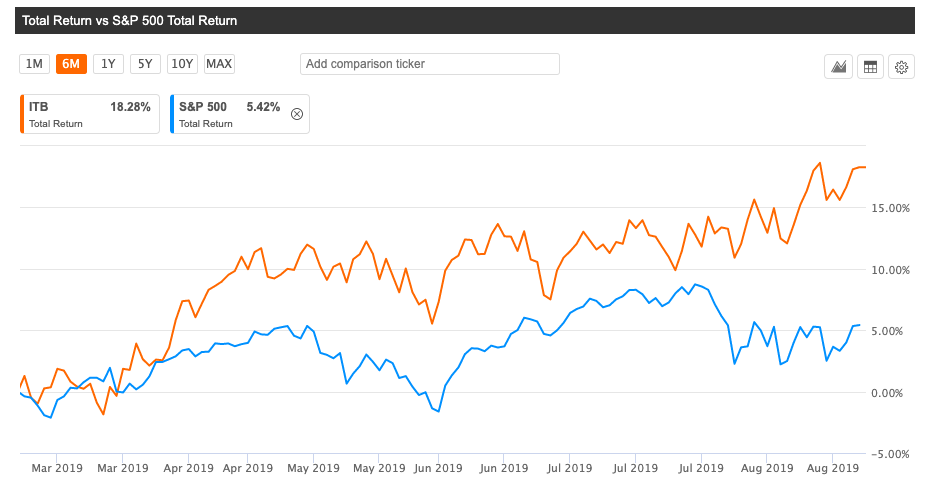
Source Seeking Alpha Essential
In order to better quantify the timing indicators, we can take a more systematic approach to price action analysis. The Sector Rotation Strategy is a quantitative system available to members in The Data-Driven Investor. This strategy rotates among a wide variety of ETFs that represent different sectors and industries based on risk-adjusted momentum.
The strategy is basically buying the ETFs with superior risk-adjusted returns over three and six months, so it's basically buying strength and selling weakness, as simple as that.
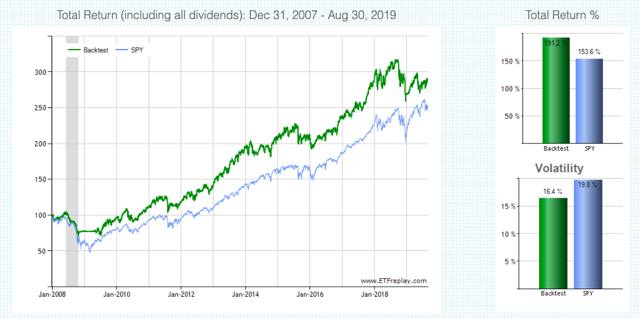
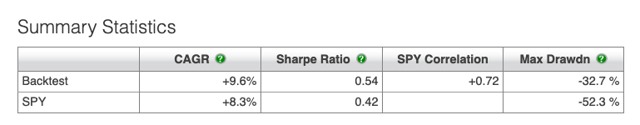
Since January of 2007, the Sector Rotation strategy produced a cumulative gain of 191.2% versus 153% for the SPDR S&P 500 (SPY) in the same period. The strategy outperformed the SPDR S&P 500 in terms of downside risk too. The maximum drawdown was 32.7% for the Sector Rotation strategy versus 55.3% for the SPDR S&P 500 in the same period. Drawdown is calculated as the greatest percentage drop from the high.
(Click on image to enlarge)
(Click on image to enlarge)
Source: ETFreplay
This strategy does not beat the market each and every year. Since the Sector Rotation strategy is based on relative strength and momentum, it performs well when trends in different sectors are long-lasting and well defined. Conversely, in periods when trends are weak and prices are moving sideways, a strategy such as this one will probably deliver disappointing returns.
Besides, momentum can be a double-edged sword, meaning that the sectors that are delivering superior returns on the way up can many times suffer the biggest losses when markets turn around. This needs to be acknowledged when implementing a strategy such as this one in order to manage portfolio risk accordingly.
Nevertheless, the data shows that following the main trends in asset prices and momentum can be an effective way to increase returns and control for downside risk over the long term.
As of the time of this writing, the iShares U.S. Home Construction ETF is one of the five ETFs selected in the Sector Rotation strategy, meaning that the ETF is ranked as one of the top 5 alternatives in the investable universe based on risk-adjusted return metrics. If the statistical evidence is any valid guide for the future, this bodes well for investors in ITB going forward.


Comments
Log in or sign up to join the conversation.