

Summary
- Global growth is forecast at 3.2 percent in 2019, picking up to 3.5 percent in 2020 (0.1 percentage point lower than in the April WEO projections for both years) - IMF.
- The Capital Observer's global GDP proxy did bottom on June 15, 2020, and has been rising since then, according to our projections for global growth.
- G5 central banks have gone beyond merely increasing global money supply (M2 and Monetary Base) – they are also easing monetary policy, and are on a race to the bottom.
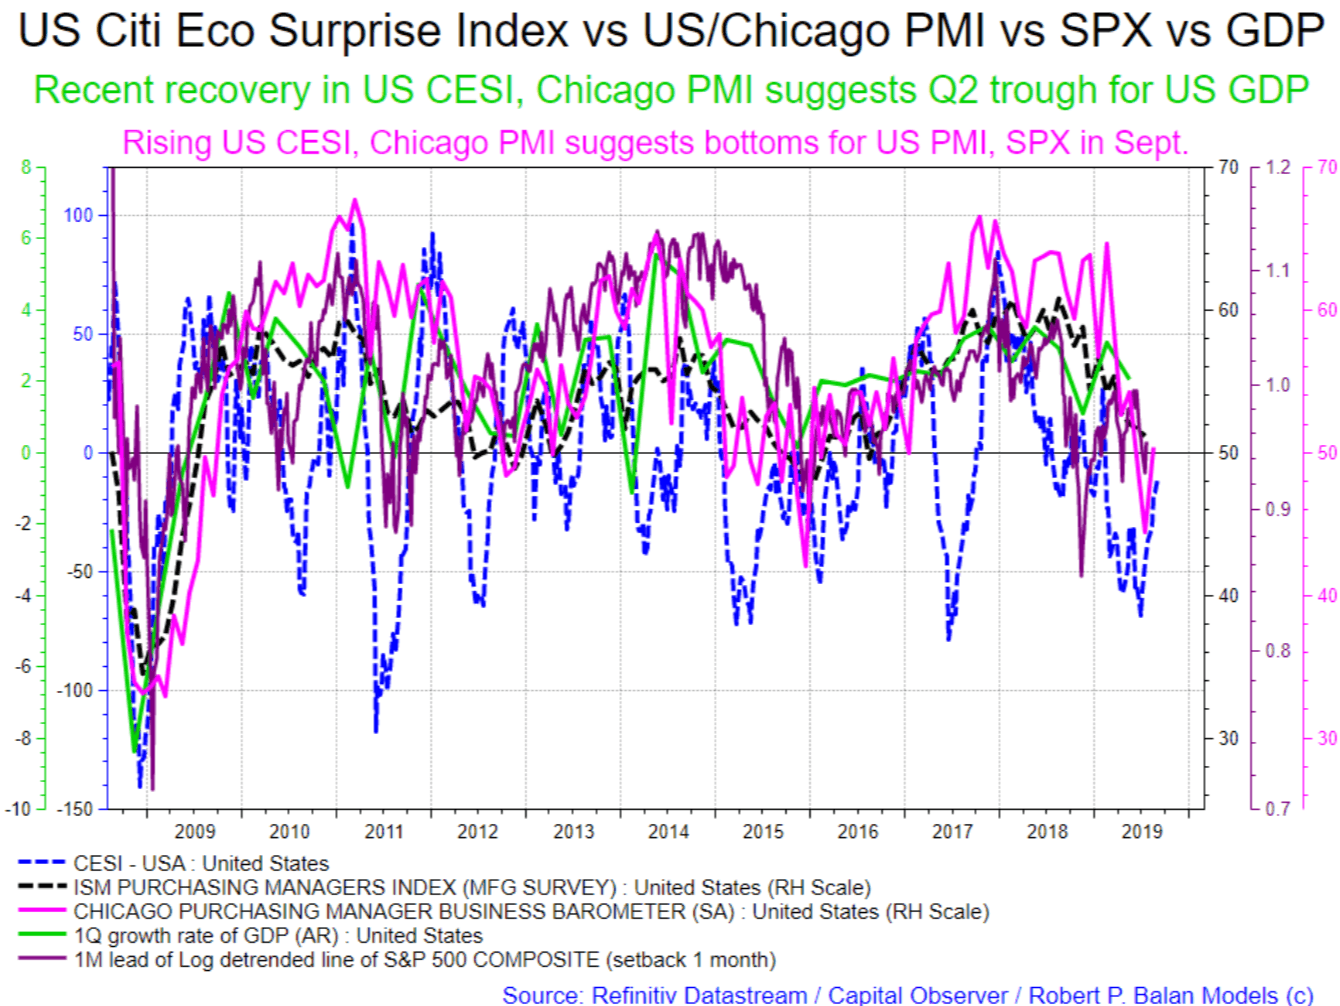
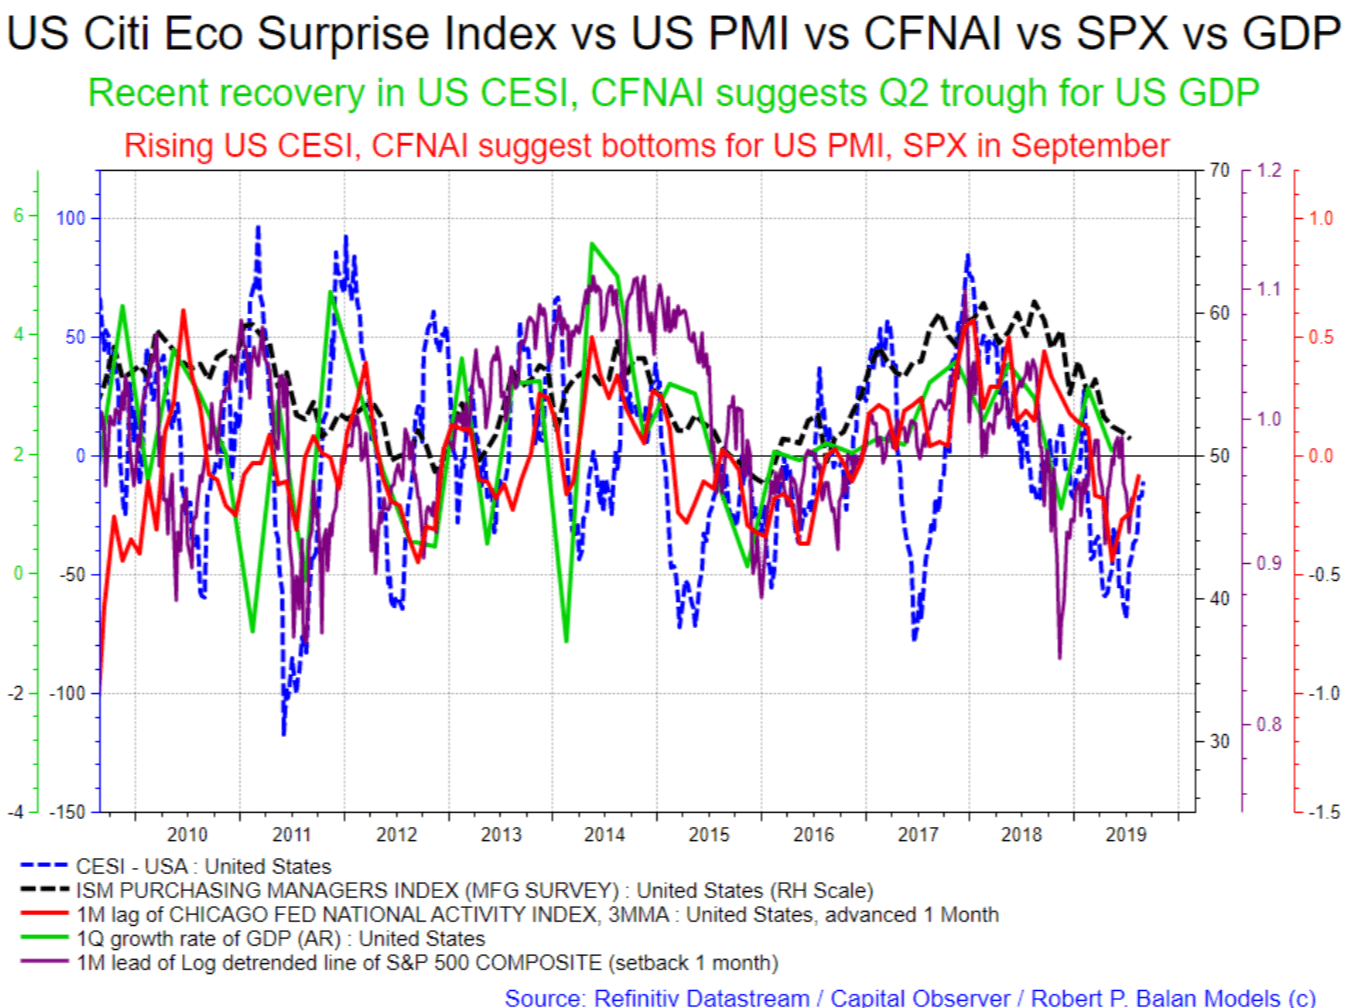
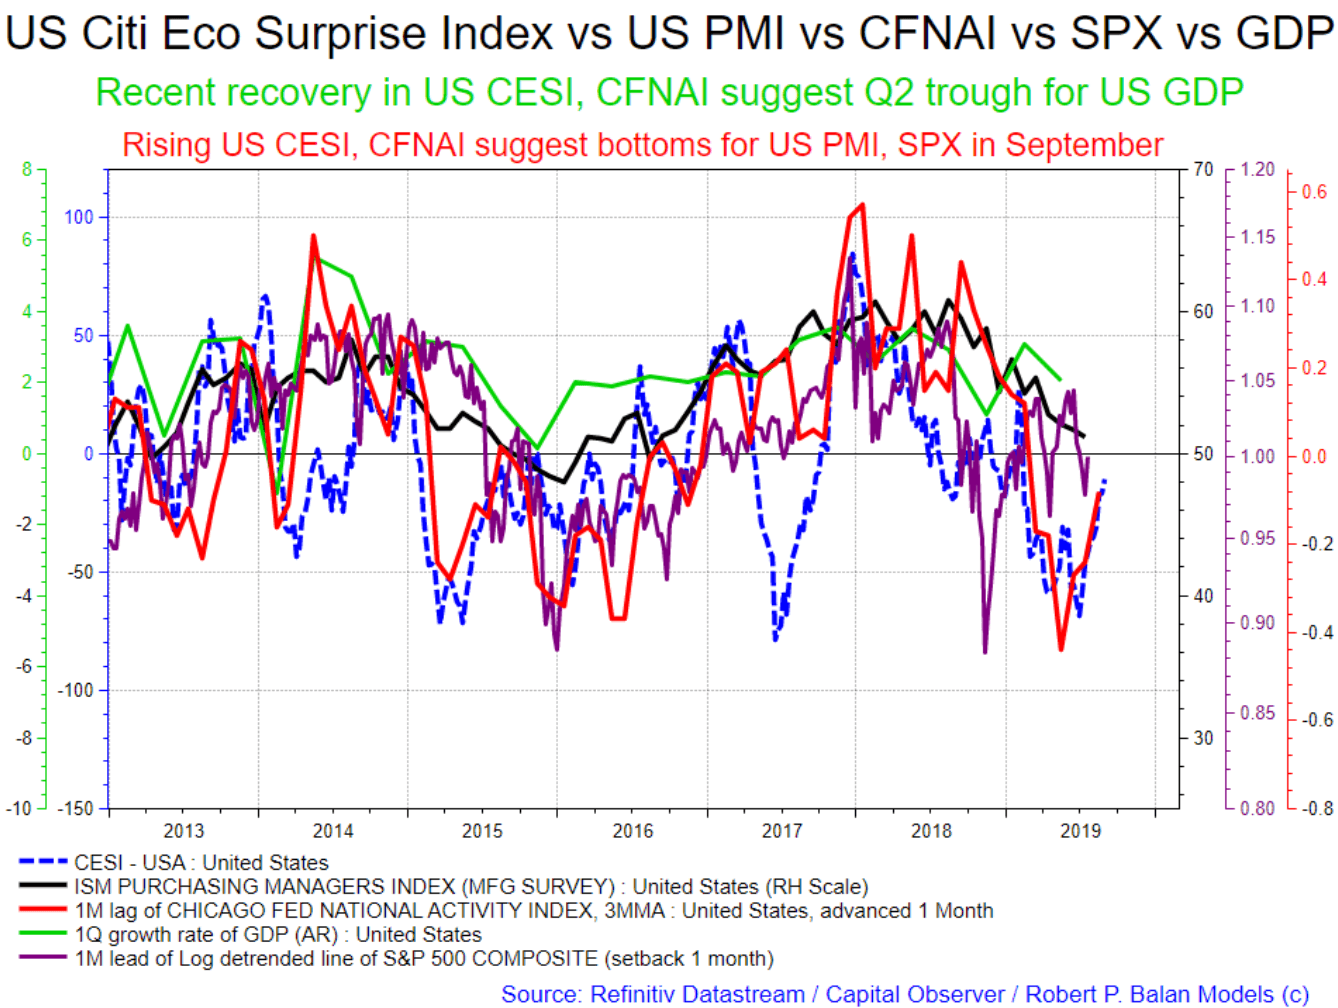
- The Chicago PMI teams up with the rising Citigroup Economic Surprise Index to indicate the high likelihood of a seeing a September bottom for the US PMI. The combo also confirms that the bottom of the US GDP has been seen in Q2 earlier this year. The CFNI is heading towards neutral, and eventually a positive reading which suggests economic growth on the upswing, makes likely a Q3 2019 US GDP higher than that of Q2.
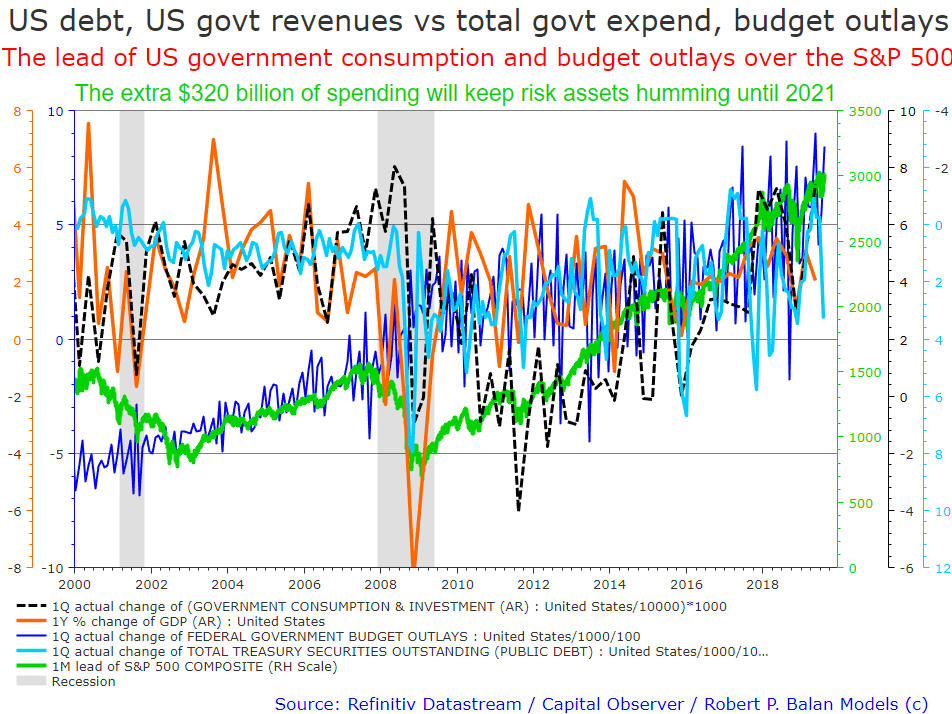
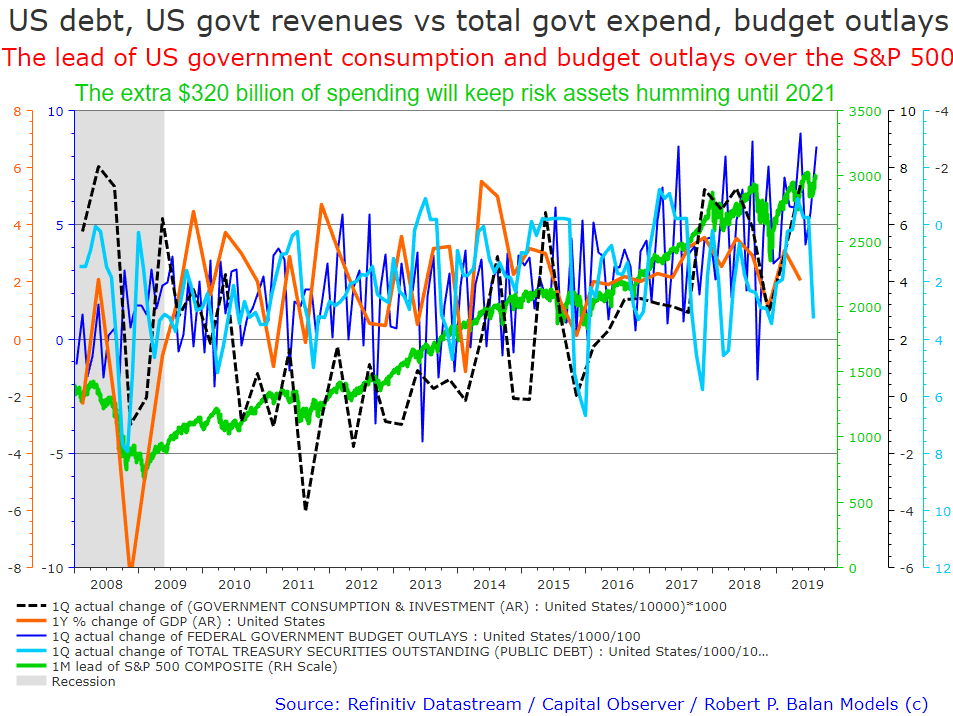
- Fiscal policy is again coming to the rescue of the economy and the financial markets. Think about this: Trump and the Democrats agreed on a new, $4.407 trillion 2-year fiscal budget, which among other things approved discretionary spending of $160 billion for each of FYI 2020 and FYI 2021.That's a lot of discretionary spending (and a lot of Treasury borrowing). That extra $320 billion of discretionary spending will keep risk assets humming until 2021.
(This is a reprint of an article in the September 2019 issue of The Capital Observer, a limited-circulation finance magazine published by Diapason Currencies and Commodities (UK). Please respect the copyright (which is rigorously enforced) -- do not forward a copy. It is just for the expressed use of the Capital Observer service subscribers. If you read this article, it signifies your acceptance of binding non-disclosure agreements, as applied to these articles and charts).
Original publication: September 15, 2019
Capital Observer in the July 2019 issue looked into the possible case of global and US growth bottoming in Q2 and Q3 this year, respectively. This is what we said then:
The Capital Observer’s outlook has always been that there will be global growth during the second half of the year, and that trend will extend into Q2 2020. IMF has provided the broader rationale for growth; but we have our own set of reason for optimism during that period. We needed a real-time proxy to test whether or not the IMF has judged the economic backdrop correctly. It looks like the international agency has done the analysis well, and their forecast of a second half global GDP growth looks spot on.
The IMF said in their April 2019 report: Global growth is expected to soften from 3.6 percent in 2018, to a projected decline to 3.3 percent in 2019. However, after the weak H1 2019 start, growth is projected to pick up in the second half of 2019.
We took the IMF’s word for an H2 recovery because the Capital Observer decided to test the IMF’s thesis of global GDP bottoming, and subsequently growing, as from the middle of 2019. We have previously created a real-time proxy of global GDP growth by taking elements from the German Deutschemark and from the Hong Kong Dollar. This synthetic currency has backtested very well, and has been out-of-sample for more than five years. It mimics global GDP very well, and as proxy, it has the advantage of providing real-time “updates” to global GDP. We show the results at the chart below (green line).
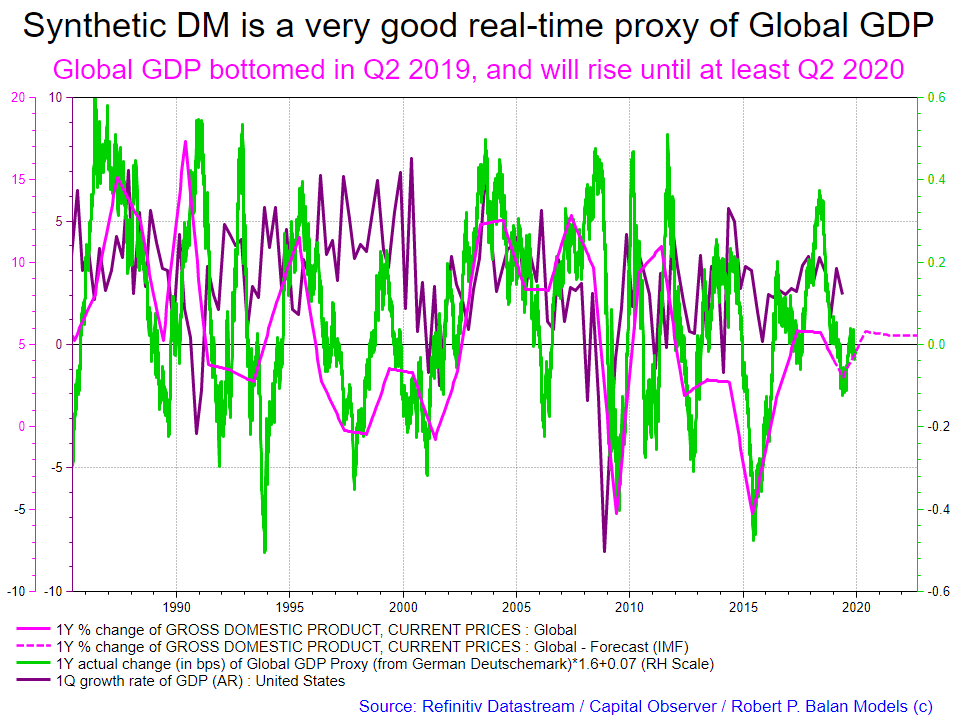
The IMF’s forecast for an H2 2019 recovery is credible even then, given that the global GDP proxy did bottom on June 15, 2020, and has been rising since then, in accordance with our projections for global growth. The IMF has since then issued an update in July 2019, saying:
Global growth is forecast at 3.2 percent in 2019, picking up to 3.5 percent in 2020 (0.1 percentage point lower than in the April WEO projections for both years)
The international agency reduced their 2020 growth forecast by 0.1%, “as the United States further increased tariffs on certain Chinese imports and China retaliated by raising tariffs on a subset of US imports.” With US President Donald Trump and President Xi Jinping of China set to meet in September, this month, the primary risks to the IMF global growth projections are set to be addressed affirmatively. Our global GDP proxy should provide a good read on what the global outlook will be as we go along, and Capital Observer will provide periodic updates.
The theme of moderate global growth, and subsequent rise in risk assets, is also supported by rising central bank provided liquidity. The G5 aggregate central bank M2 Money supply and balance sheet has been very supportive of global growth, and the rise in global financial risk assets (see chart below). The G5 central banks are the US Federal Reserve Bank (FRB), the European Central Bank (ECB), Bank of Japan (BoJ), The Peoples’ Bank Of China (PBoC) and the Swiss National Bank (SNB).
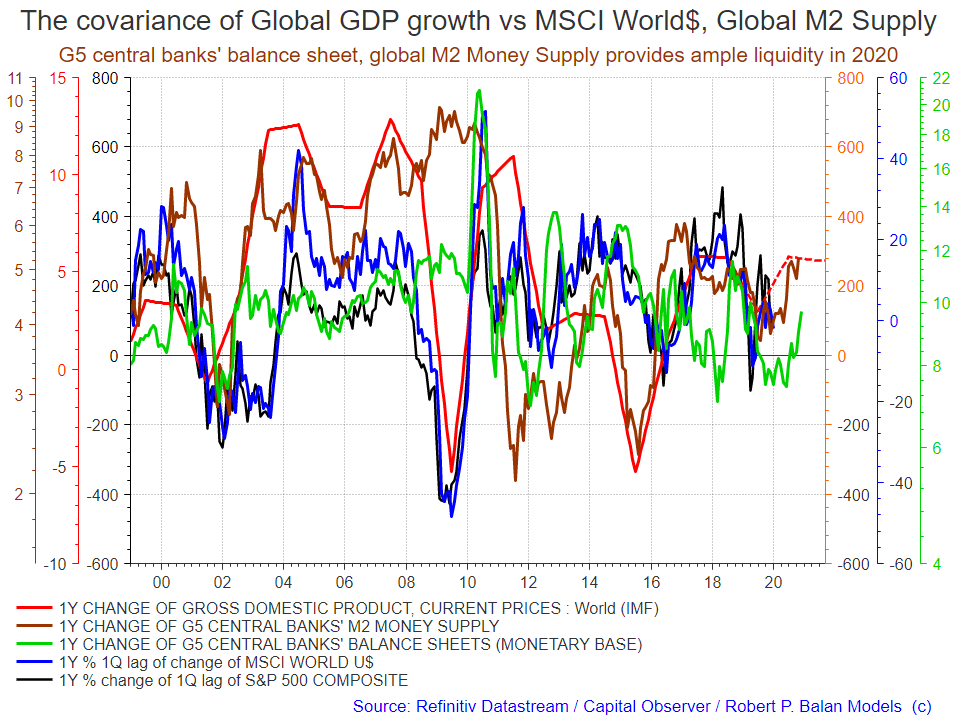
These monetary aggregates usually lead GDP growth and the price of risk assets by 5 to 6 quarters. The central banks have gone beyond increasing global money supply (M2 and Monetary Base) – the major central banks are also easing monetary policy, and have been on the race to the bottom in lowering policy rates. The most recent examples are of course the ECB, which will be on easing mode over the next 12 months, the PBoC, which just cut Required Reserve Ratios to free more cash to be lent out by commercial banks, and of course the FRB (FED) which cut rates in July, and are expected to cut rates further during their September meeting next week.
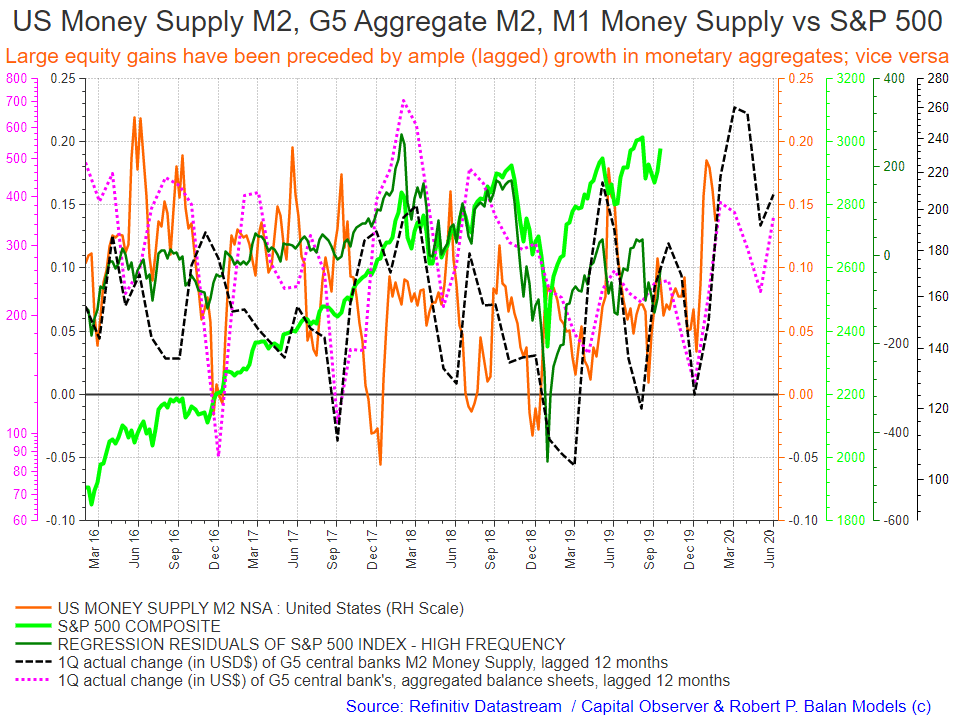
With the double-barrelled approach of increasing systemic monetary liquidity, and declining costs of funds, global risk assets should catch massive bids before long. Equity prices should rise smartly, and bond yields should soar. US risks assets are especially receptive to monetary inflows from the G5 and FRB itself (see chart below).
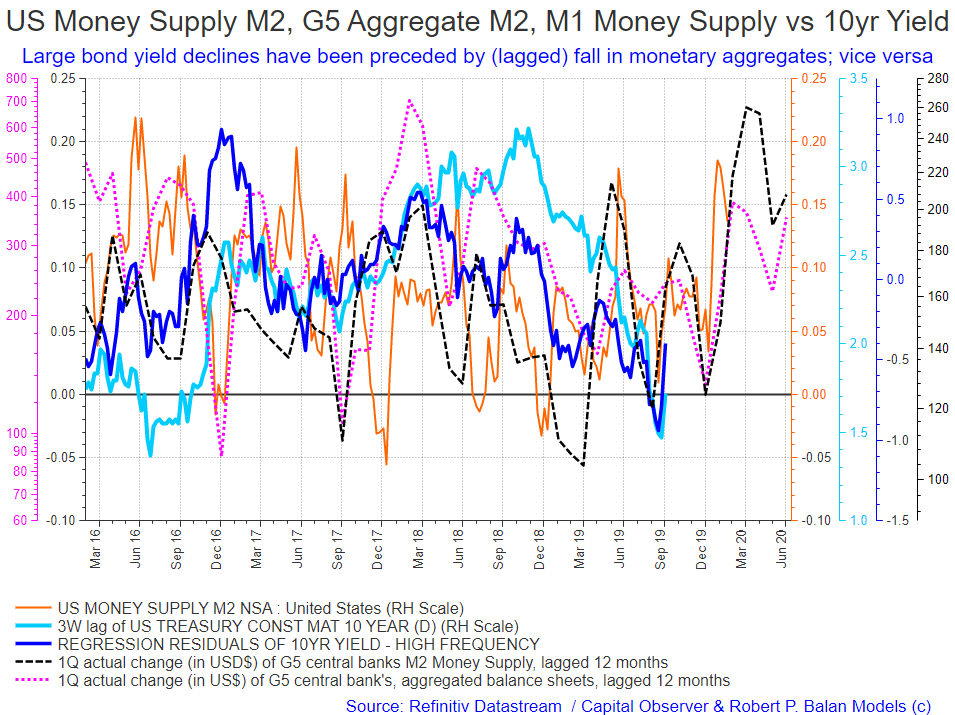
And the price/yield of safe haven bond assets rise/fall when monetary liquidity levels decline (after a lag). And the inverse is also true – the price/yield of safe haven bond assets fall/rise when liquidity conditions improve (after a lag); see chart below:
That is exactly the reason why at Capital Observer it is imperative for us to validate the potential for global growth in 2020. Over the past 12 months, global equities are up just 1%, the S&P 500 is just up 4%. After the challenges of the past year, it is imperative to ask whether conditions are going to get better, or worse relative to a year ago. We believe that the situation will turn around. Important asset allocations require a prior knowledge of likely global growth trends over the next year. That is why we are offering our own rationale for global growth during the period from Q3 2019 to Q2 2020.
These positive global conditions, described above, have been building over the past several months, but many investors have likely overlooked these factors as they focus on the falling US and Global PMIs, the global trade backdrop (as the US-China trade spat shows no signs of immediate solutions), the inversion of global yield curves, and lower commodity prices.
The fact remains that according to almost all surveys, investors are positioned for mid-cycle, others late-cycle and still others recession, and very few appear prepared for global and US growth over the next 4 quarters. Investors’ fears are undoubtedly driven by what they believe to be the possible worst case to be brought about by those negative developments.
But what if those perceptions are wrong, and we can show proxies that recently negative macro developments are on the mend?
The US Manufacturing PMIs have turned around:
On the heels of rebounds across various regional Fed surveys, Chicago's PMI survey rebounded from recession-signaling lows in July, jumping from 44.4 to 50.4 (back into expansion) in August. New orders rose and the direction reversed, signalling expansion. Order backlogs also rose and the direction reversed, signalling expansion. And business activity has been positive for 8 months over the past year.
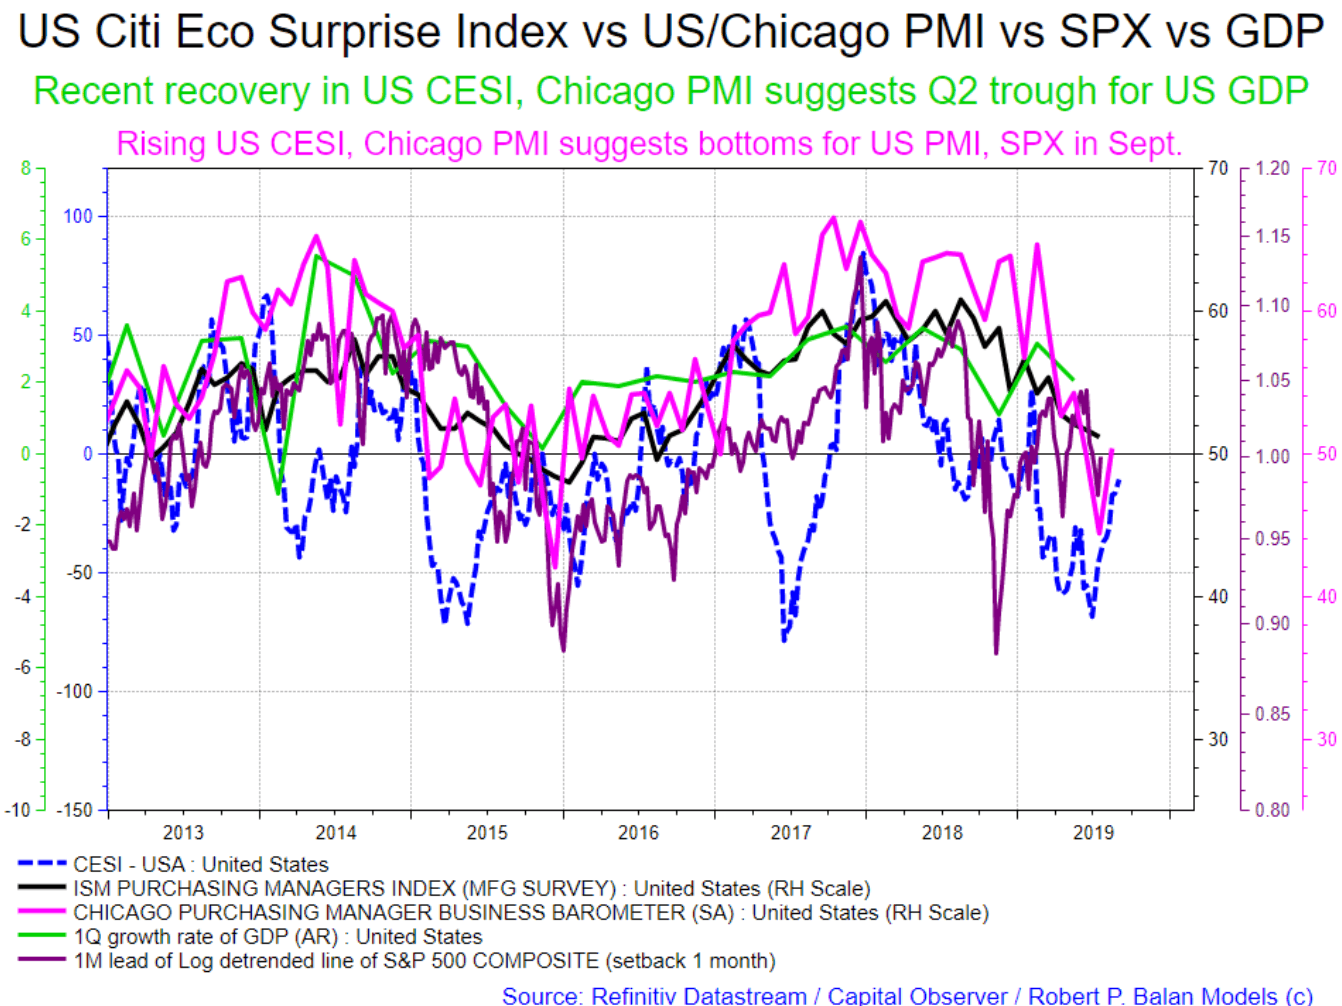
But best of all, the Chicago PMI teams up with the rising Citigroup Economic Surprise Index to indicate the high likelihood of a seeing a September bottom for the US PMI. And in addition to that, the combo also confirms that the bottom of the US GDP has been seen in Q2 earlier this year.
Zoomed-in View
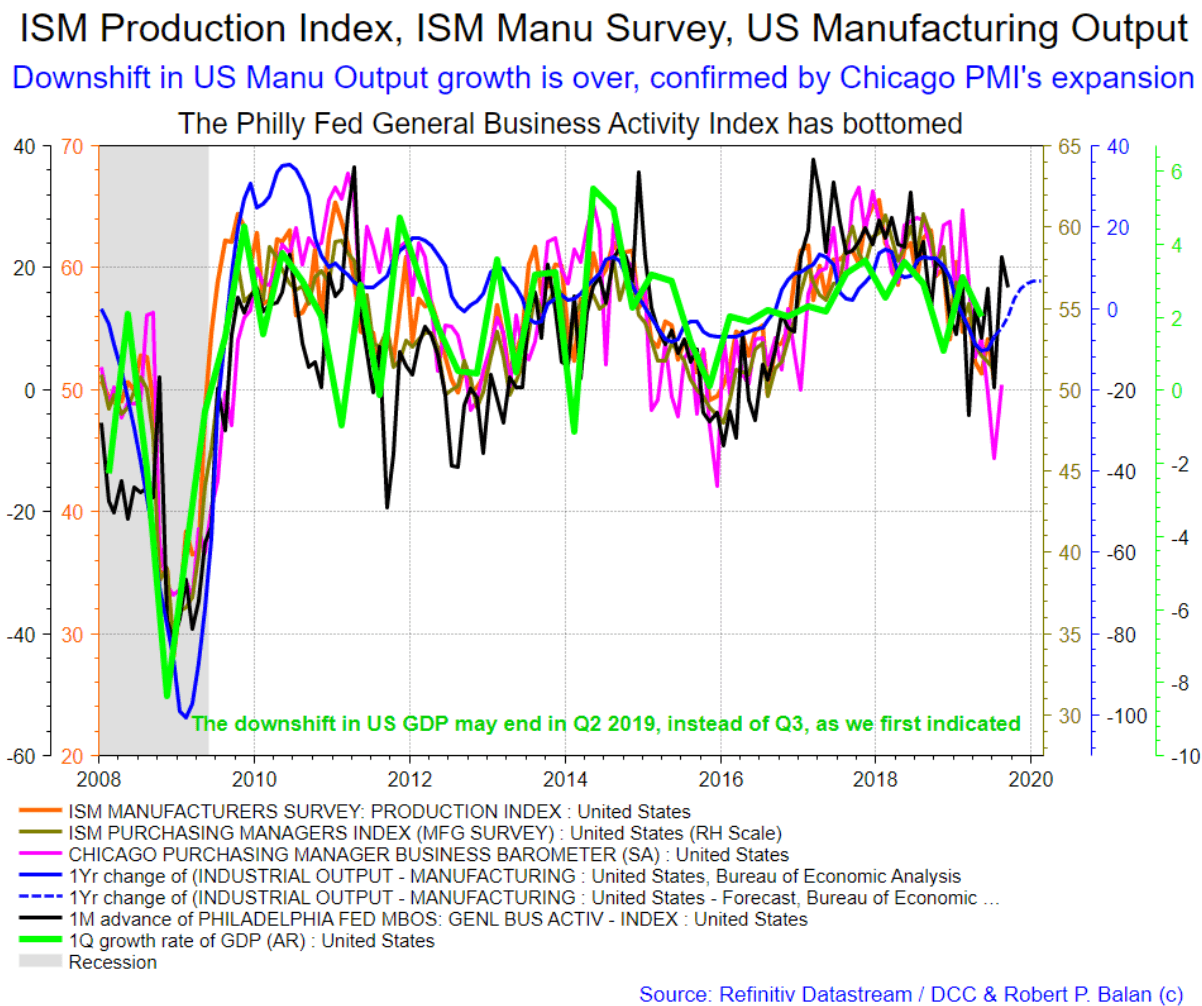
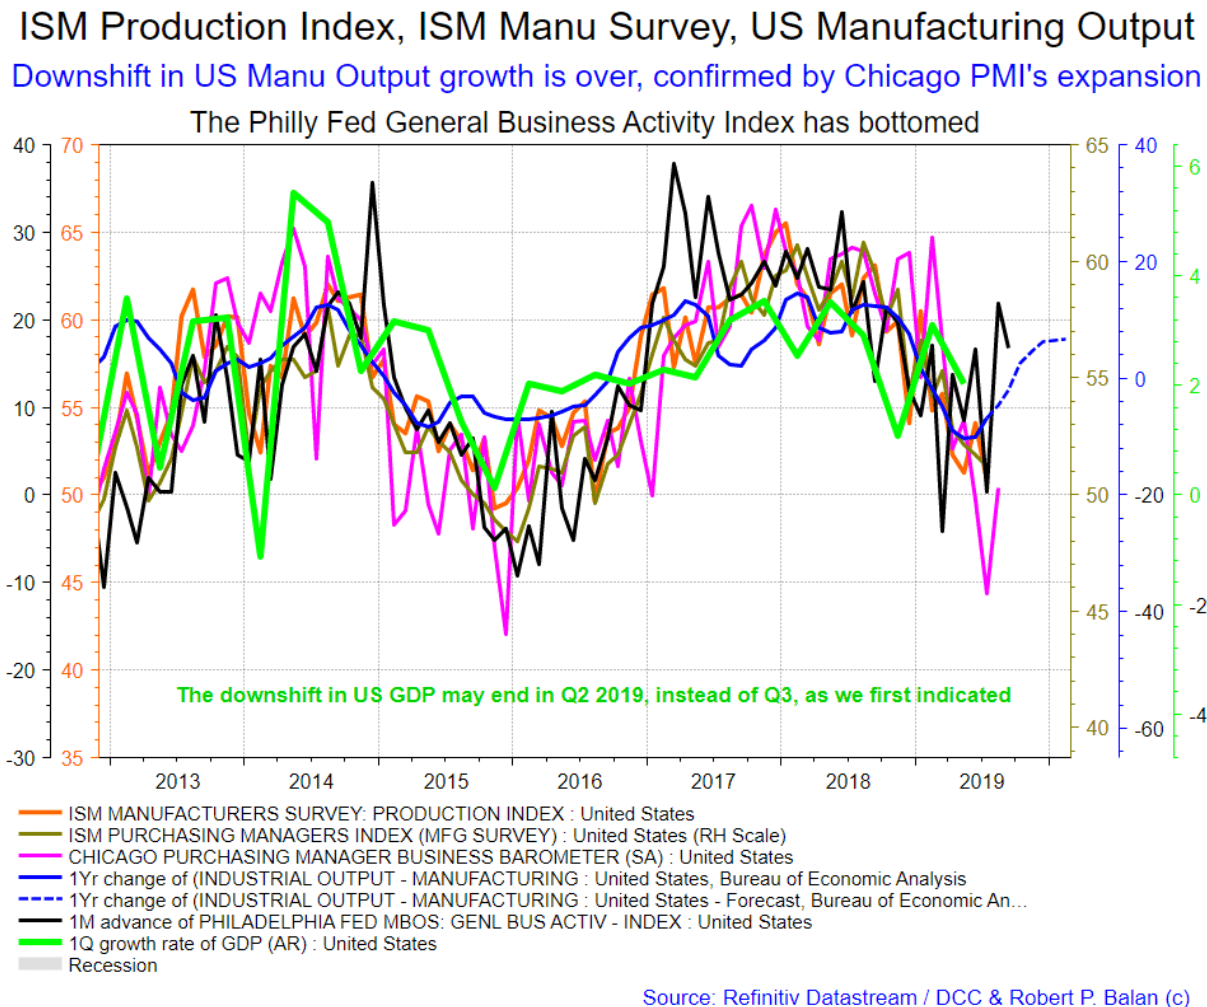
The turn around in the Chicago PMI also confirms the lead indications from the internals of the US ISM and manufacturing output data. If we juxtapose those internal data with the upturn in the Philly Fed General Business Activity Index, which has bottomed, then we come to conclusion that the downshift in US manufacturing output growth is over – the inflection points higher in the data, and upturn in the ISM production Index, are likely just a month away.
Zoomed In View
US economic activity is now on the mend – growth and manufacturing on the upturn
The CFNAI is a weighted average of 85 existing monthly indicators of national economic activity. It is constructed to have an average value of zero and a standard deviation of one. Since economic activity tends toward trend growth rate over time, a positive index reading corresponds to growth above trend and a negative index reading corresponds to growth below trend.
In its current state, the CFNI is heading towards neutral, and eventually a positive reading which suggests economic growth on the upswing. US economic activity is usually led by a bevy of indicators including the Citigroup Economic Surprise Index and even the S&P 500 Index. All of these lead indicators have already been on the upswing, which makes likely a Q3 2019 US GDP higher than that of Q2.
Zoomed-in View
Fiscal policy set to reignite the economy and financial markets
Finally, fiscal policy is again coming to the rescue of the economy and the financial markets. Think about this: Trump and the Democrats agreed on a new, $4.407 trillion 2-year fiscal budget, which among other things approved discretionary spending of $160 billion for each of FYI 2020 and FYI 2021.
That's a lot of discretionary spending (and a lot of Treasury borrowing). Spending and borrowing have been great for economic growth and the financial markets. That extra $320 billion of discretionary spending will keep risk assets humming until 2021. An in the process, all that money being thrown on the economy should charge up US GDP growth.
Zoomed View
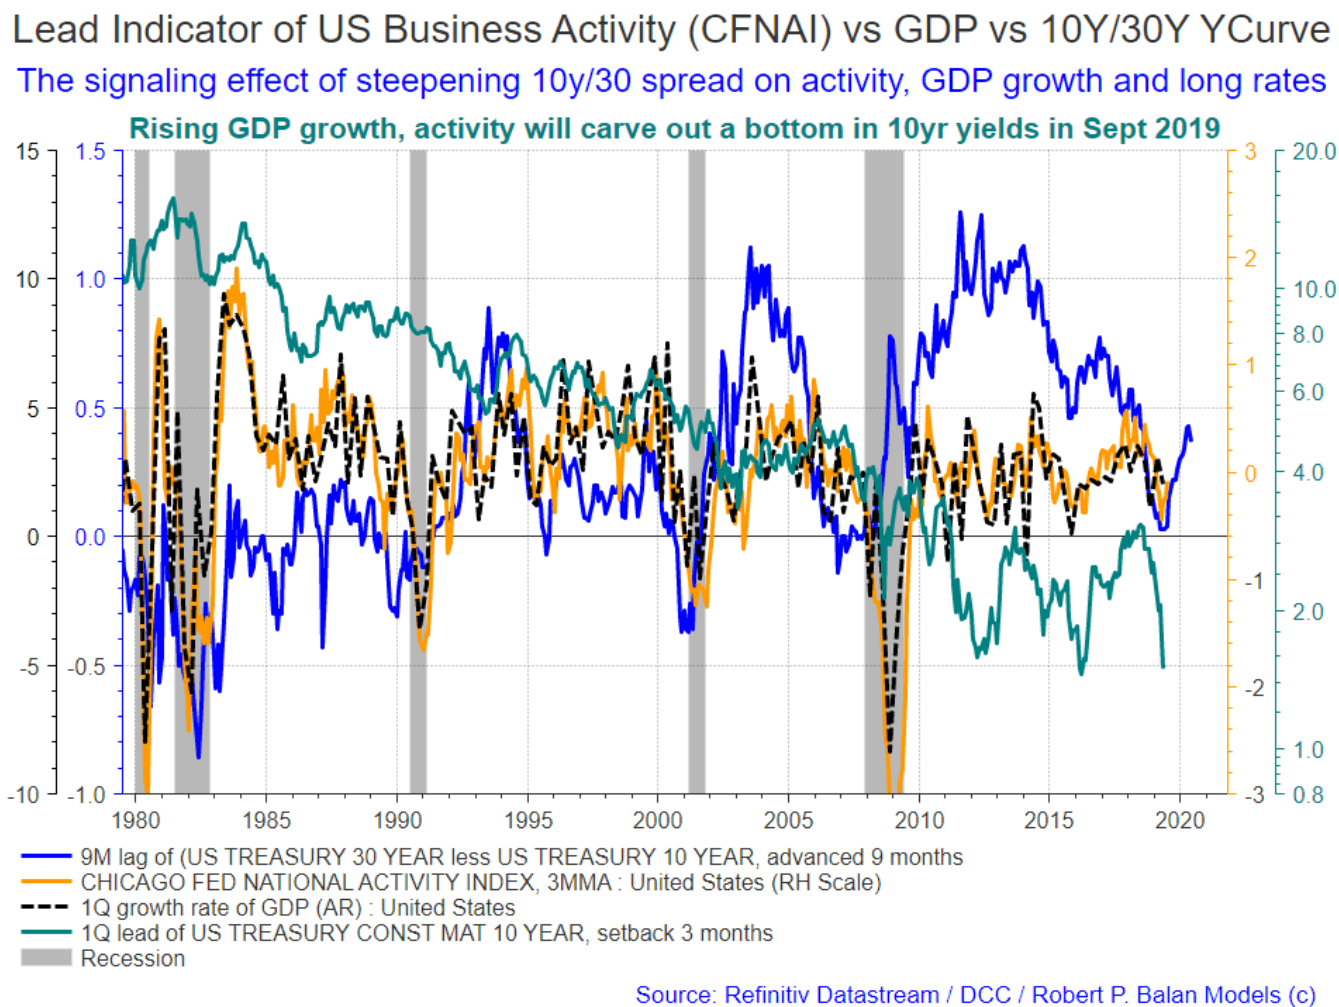
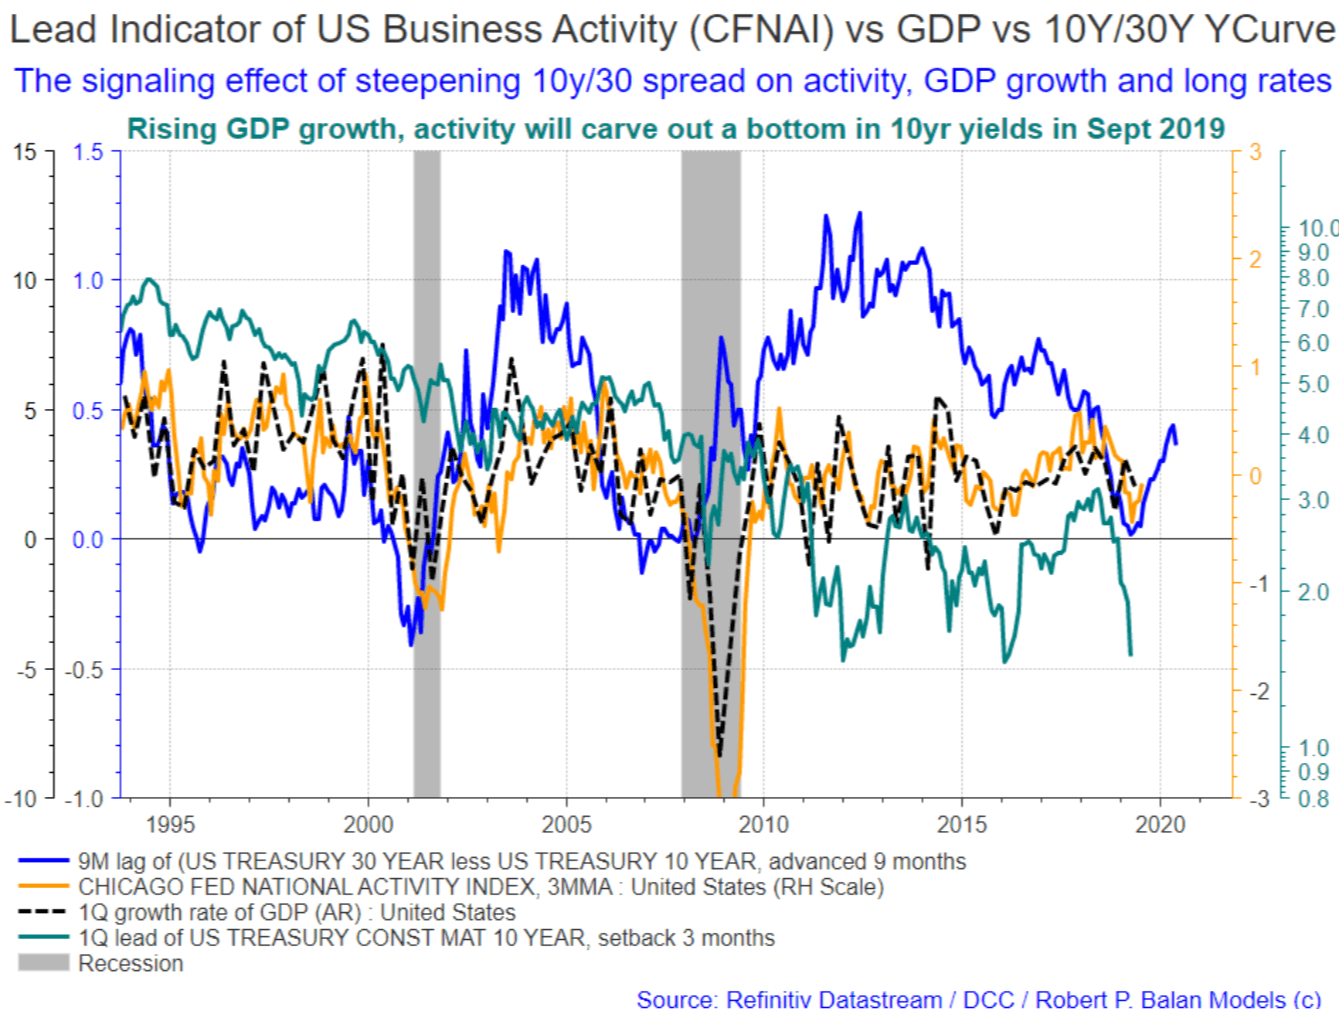
The signalling effect of the US yield curve: the 10yr yield should rise
The inversion of the US front yield curve (3Yr/10Yr) has been taken as ill-omen by investors, as a portent of subsequent recession (after 4 to 5 quarters). Therefore, it follows that a steepening of the yield curve SHOULD be taken as positive for growth and financial assets, and that is happening at the back-end of the yield curve, in the 10Yr/30Yr spread. And the good portents are happening now.
The signalling effect of steepening 10y/30 spread on activity, GDP growth and long rates should be part of the positive news for the next 3 to 4 quarters. With economic activity (CFNAI) and GDP set to turn around soon (as soon as September this year), the 10yr yield should respond to better economic circumstances -- rising GDP growth, activity will carve out a bottom in 10yr yields in Sept 2019.
Zoomed In View
Copyright: Diapason Currencies and Commodities (London), Capital Observer

Comments
Log in or sign up to join the conversation.