
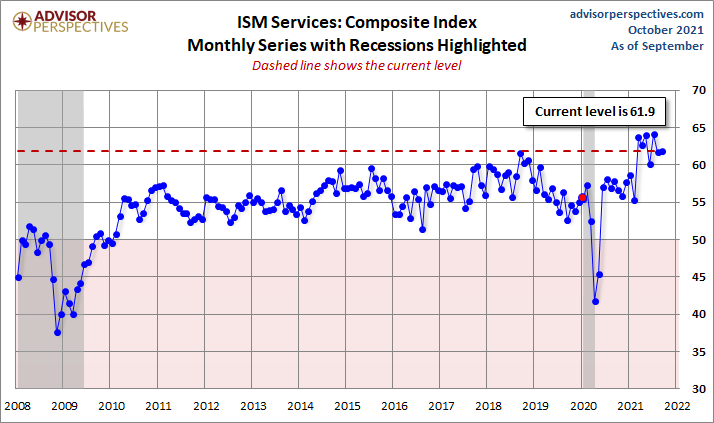
The Institute of Supply Management (ISM) has now released the September Services Purchasing Managers' Index (PMI). The headline Composite Index is at percent 61.9, up 0.2 from 61.7 last month. Today's number came in above the Investing.com forecast of 60.0 percent.
Here is the report summary:
(Tempe, Arizona) — Economic activity in the services sector grew in September for the 16th month in a row, say the nation’s purchasing and supply executives in the latest Services ISM® Report On Business®.
The report was issued today by Anthony Nieves, CPSM, C.P.M., A.P.P., CFPM, Chair of the Institute for Supply Management® (ISM®) Services Business Survey Committee: “The Services PMI® registered 61.9 percent, 0.2 percentage point higher than the reading of 61.7 percent in August. The September reading indicates the 16th straight month of growth for the services sector, which has expanded for all but two of the last 140 months.
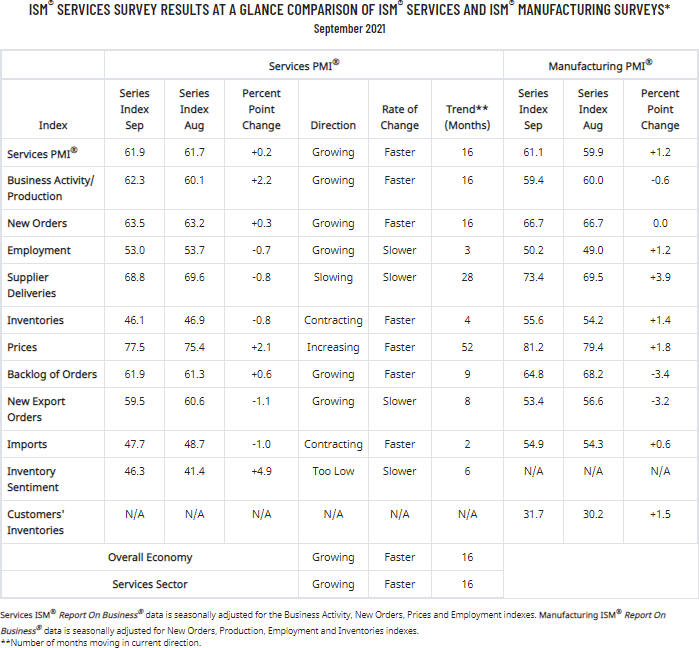
“The Supplier Deliveries Index registered 68.8 percent, down 0.8 percentage point from August’s reading of 69.6 percent. (Supplier Deliveries is the only ISM® Report On Business® index that is inversed; a reading of above 50 percent indicates slower deliveries, which is typical as the economy improves and customer demand increases.) The Prices Index registered 77.5 percent, up 2.1 percentage points from the August figure of 75.4 percent.”
Nieves continues, “According to the Services PMI®, 17 services industries reported growth. The composite index indicated growth for the 16th consecutive month after a two-month contraction in April and May 2020. The slight uptick in the rate of expansion in the month of September continued the current period of strong growth for the services sector. However, ongoing challenges with labor resources, logistics, and materials are affecting the continuity of supply.” [Source]
Unlike its much older kin, the ISM Manufacturing Series, there is relatively little history for ISM's Non-Manufacturing data, especially for the headline Composite Index, which dates from 2008. The chart below shows the Non-Manufacturing Composite.
The more interesting and useful subcomponent is the Non-Manufacturing Business Activity Index. The latest data point at 62.3 percent is up 2.2 from a seasonally adjusted 60.1 the previous month.
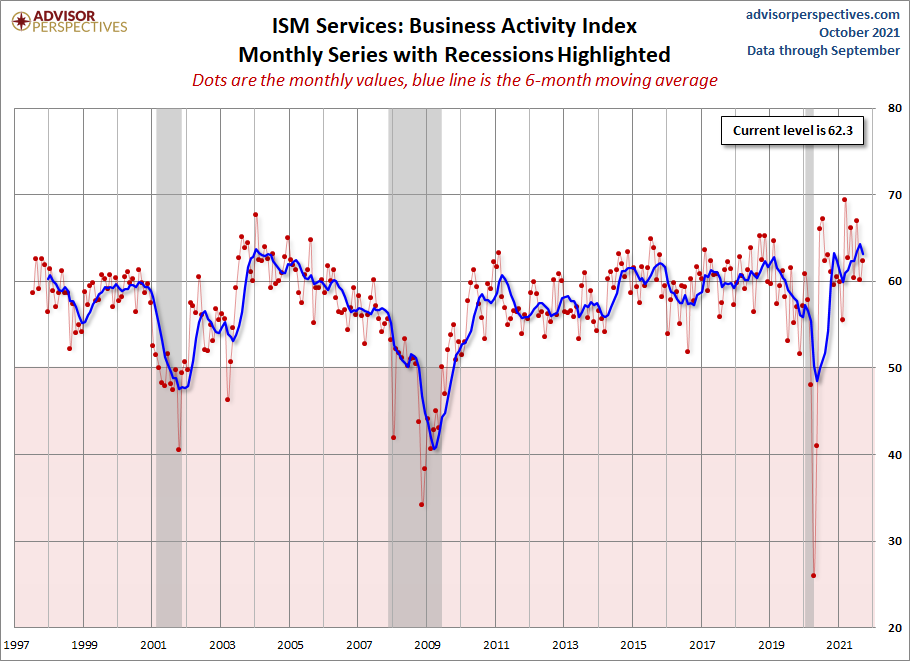
For a diffusion index, this can be an extremely volatile indicator, hence the addition of a six-month moving average to help us visualize the short-term trends.
Theoretically, this indicator should become more useful as the time frame of its coverage expands. Manufacturing may be a more sensitive barometer than Non-Manufacturing activity, but we are increasingly a services-oriented economy, which explains our intention to keep this series on the radar.
Here is a table showing the trend in the underlying components.
(Click on image to enlarge)


Comments
Log in or sign up to join the conversation.