
The Institute of Supply Management (ISM) has now released the January Services Purchasing Managers' Index (PMI). The headline Composite Index is at 59.9 percent, down 2.4 from 62.3 last month. Today's number came in above the Investing.com forecast of 59.5 percent.
Here is the report summary:
(Tempe, Arizona) — Economic activity in the services sector grew in January for the 20th month in a row — with the Services PMI® registering 59.9 percent — say the nation’s purchasing and supply executives in the latest Services ISM® Report On Business®.
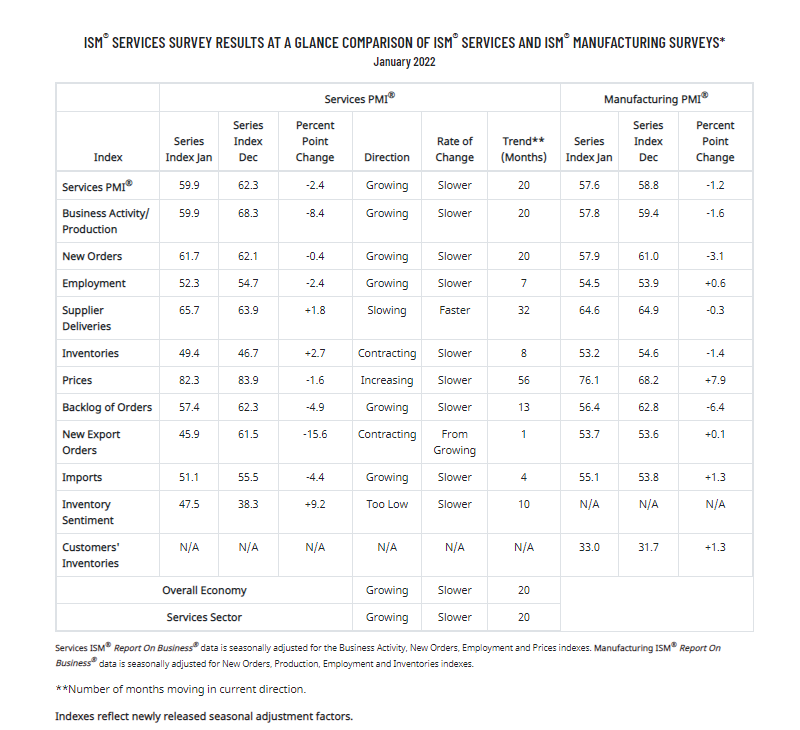
The report was issued today by Anthony Nieves, CPSM, C.P.M., A.P.P., CFPM, Chair of the Institute for Supply Management® (ISM®) Services Business Survey Committee: “In January, the Services PMI® registered 59.9 percent, 2.4 percentage points below December’s seasonally adjusted reading of 62.3 percent. The Business Activity Index registered 59.9 percent, a decrease of 8.4 percentage points compared to the seasonally adjusted reading of 68.3 percent in December, and the New Orders Index registered 61.7 percent, 0.4 percentage point lower than the seasonally adjusted reading of 62.1 percent reported in December.
“The Supplier Deliveries Index registered 65.7 percent, 1.8 percentage points higher than the 63.9 percent that was reported in December. (Supplier Deliveries is the only ISM® Report On Business® index that is inversed; a reading of above 50 percent indicates slower deliveries, which is typical as the economy improves and customer demand increases.)
“The Prices Index registered 82.3 percent, down 1.6 percentage points from the seasonally adjusted December figure of 83.9 percent. Services businesses continue to struggle replenishing inventories, as the Inventories Index (49.4 percent, up 2.7 percentage points from December’s reading of 46.7 percent) and the Inventory Sentiment Index (registering 47.5 percent, up a healthy 9.2 percentage points from December’s reading of 38.3 percent) remained in contraction or ‘too low’ territory in January.”
Nieves continues, “According to the Services PMI®, 15 services industries reported growth. The composite index indicated growth for the 20th consecutive month after a two-month contraction in April and May 2020. Although there was a pullback for most of the subindexes in January, the rate of growth remains strong for the services sector, which has expanded for all but two of the last 144 months. Respondents continue to be impacted by coronavirus pandemic-related supply chain issues, including capacity constraints, demand-pull inflation, logistical challenges and labor shortages. Moreover, the COVID-19 omicron variant has disrupted operations, especially through reduced staffing levels. Despite these impediments, business activity and economic growth continue.” [Source]
Unlike its much older kin, the ISM Manufacturing Series, there is a relatively little history for ISM's Non-Manufacturing data, especially for the headline Composite Index, which dates from 2008. The chart below shows the Non-Manufacturing Composite.
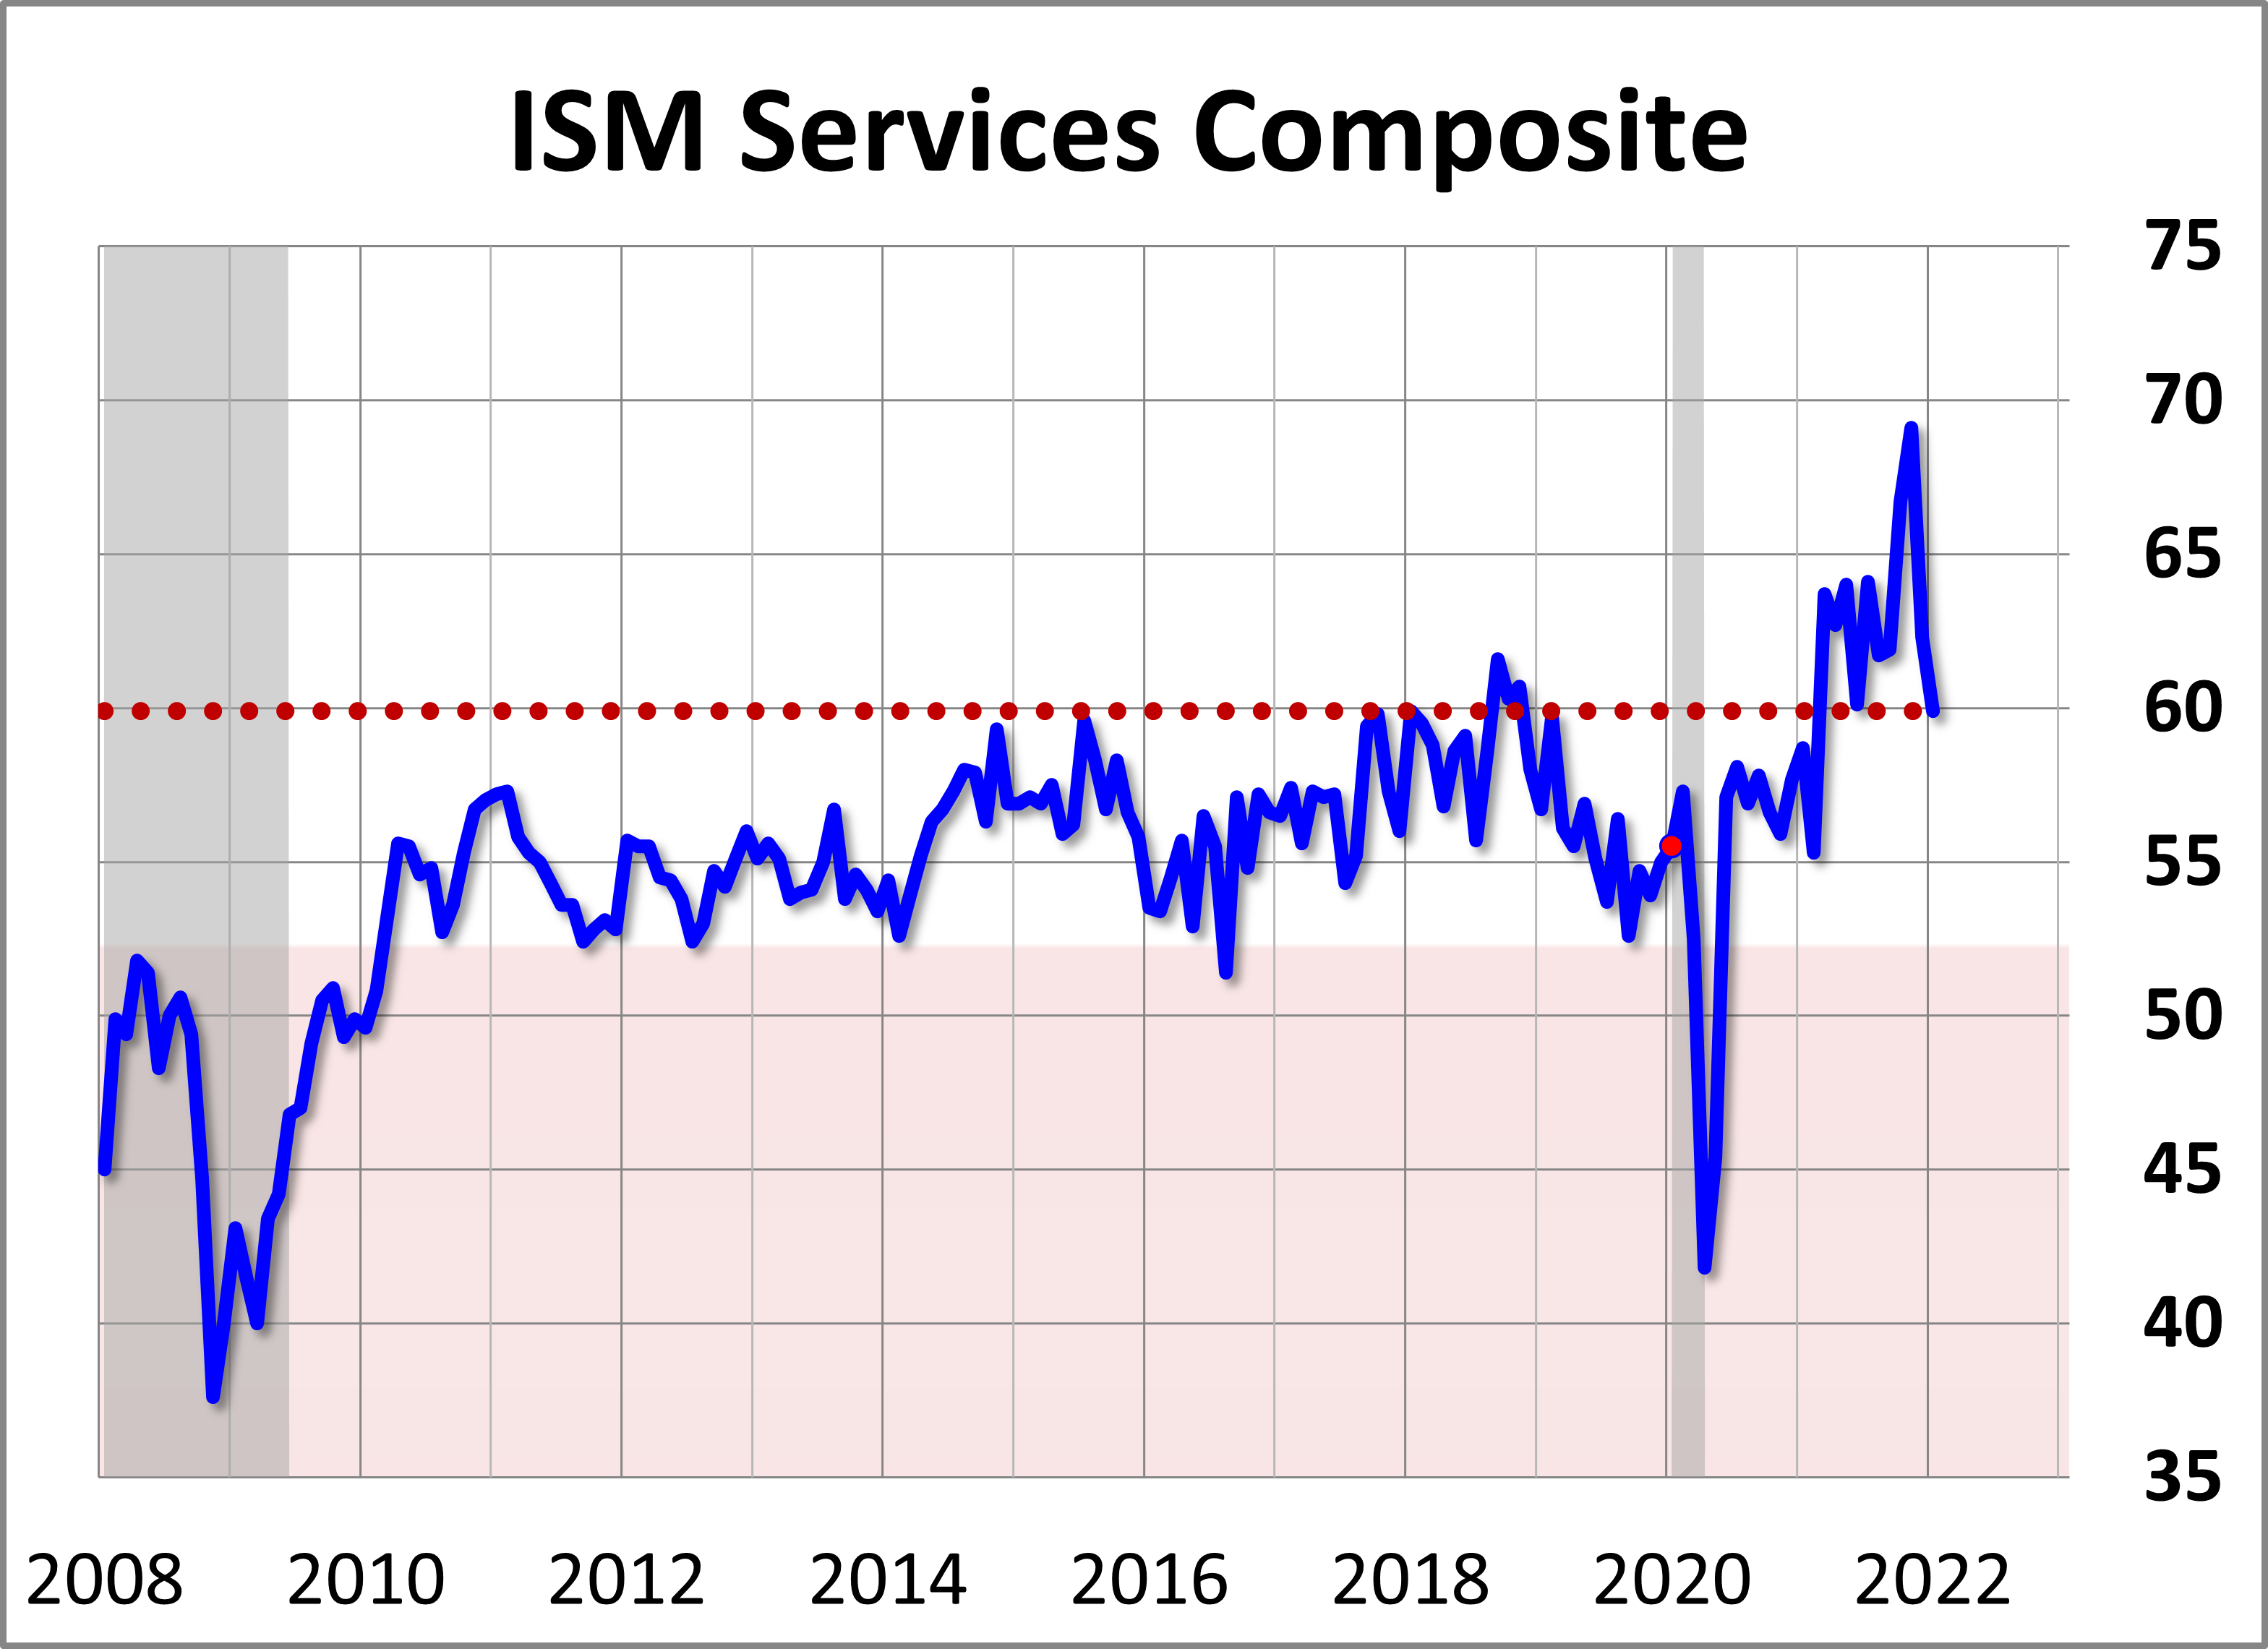
The more interesting and useful subcomponent is the Non-Manufacturing Business Activity Index. The latest data point at 59.9 percent is down 2.4 from a seasonally adjusted 62.3 the previous month.
(Click on image to enlarge)
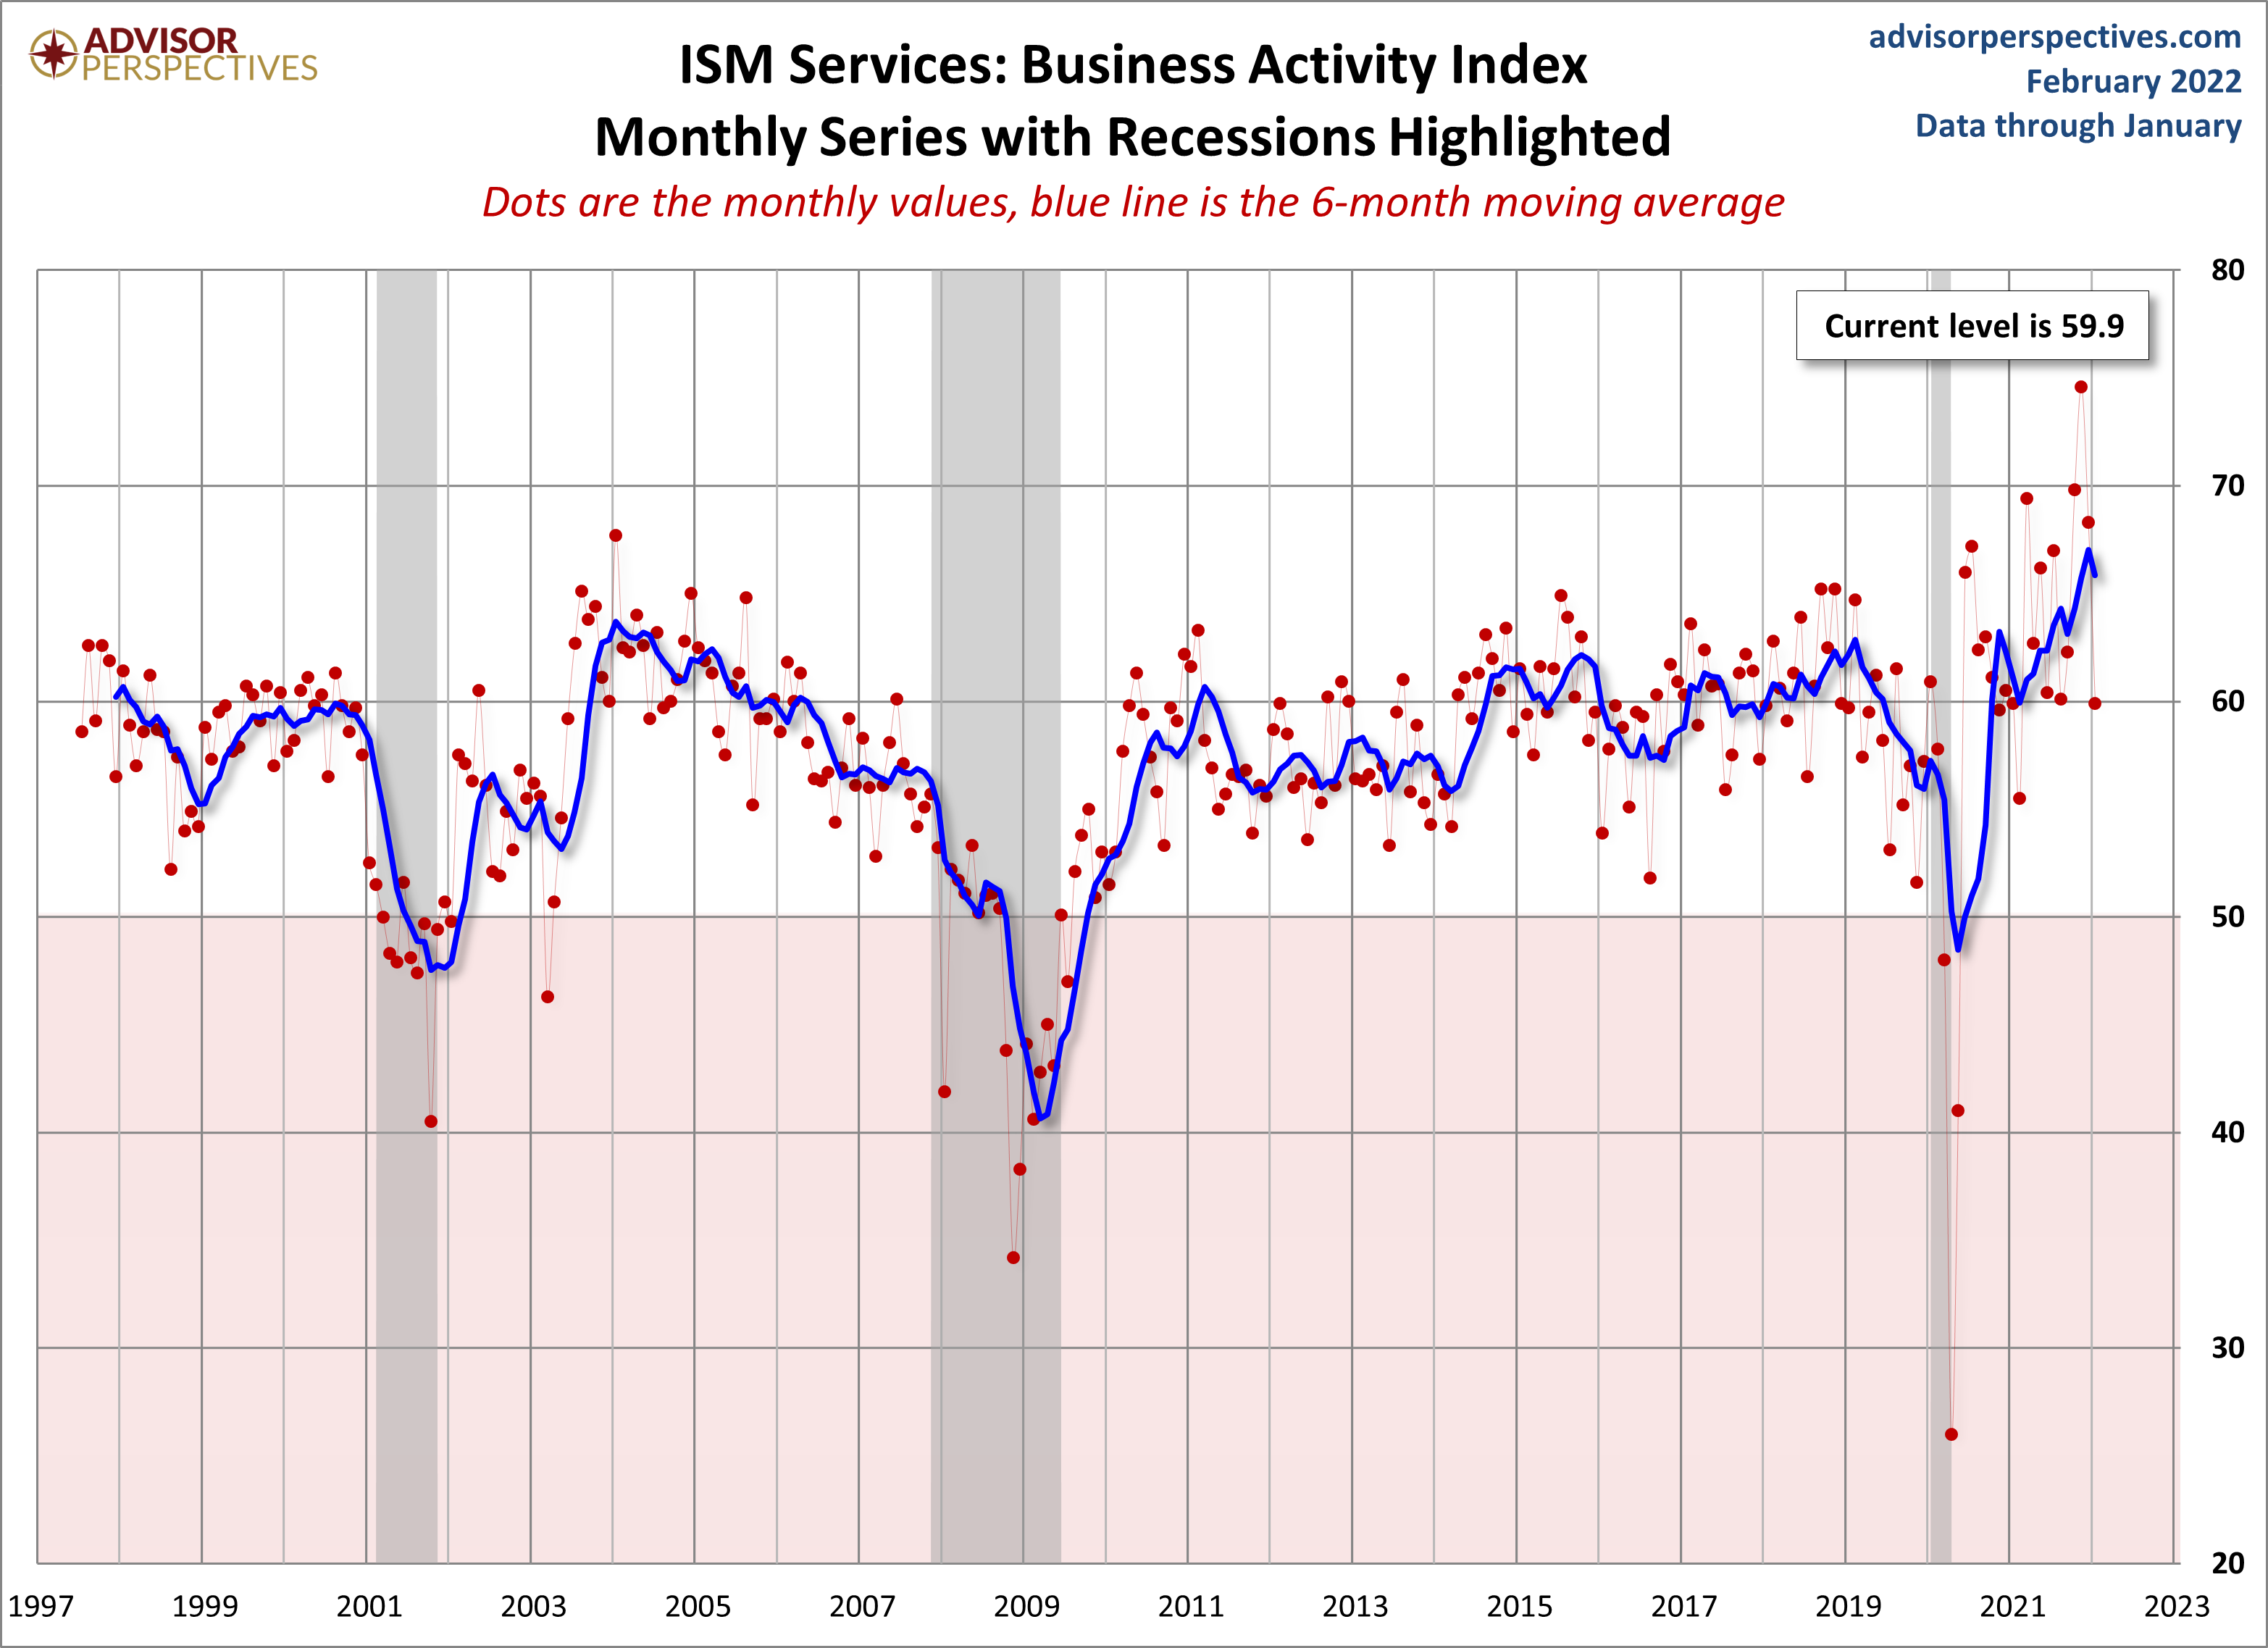
For a diffusion index, this can be an extremely volatile indicator, hence the addition of a six-month moving average to help us visualize the short-term trends.
Theoretically, this indicator should become more useful as the time frame of its coverage expands. Manufacturing may be a more sensitive barometer than Non-Manufacturing activity, but we are increasingly a services-oriented economy, which explains our intention to keep this series on the radar.
Here is a table showing the trend in the underlying components.
(Click on image to enlarge)


Comments
Log in or sign up to join the conversation.