
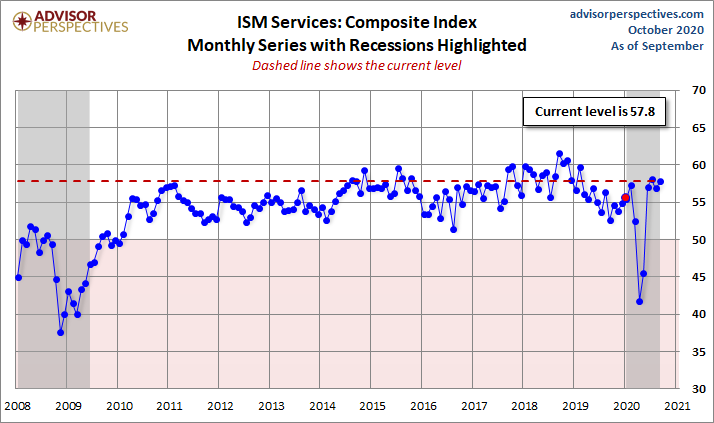
The Institute of Supply Management (ISM) has now released the September Services Purchasing Managers' Index (PMI). The headline Composite Index is at percent 57.8, up 0.9 from 56.9 last month. Today's number came in above the Investing.com forecast of 56.3 percent.
Here is the report summary:
In September, the Services PMI™ (formerly the Non-Manufacturing NMI®) registered 57.8 percent, 0.9 percentage point higher than August’s figure of 56.9 percent. The reading indicates the services sector grew for the fourth consecutive month after two months of contraction and 122 months of growth before that. A reading above 50 percent indicates the services sector economy is generally expanding; below 50 percent indicates the services sector is generally contracting.
ISM®’s Business Activity Index registered 63 percent in September, an increase of 0.6 percentage point from the August reading of 62.4 percent. This represents growth for the fourth consecutive month. Comments from respondents include: “End of fiscal year spending” and “Resuming projects placed on hold due to COVID-19.” [Source]
Unlike its much older kin, the ISM Manufacturing Series, there is relatively little history for ISM's Non-Manufacturing data, especially for the headline Composite Index, which dates from 2008. The chart below shows the Non-Manufacturing Composite. We have only a single recession to gauge is behavior as a business cycle indicator.
The more interesting and useful subcomponent is the Non-Manufacturing Business Activity Index. The latest data point at 63.0 percent is up 0.6 from a seasonally adjusted 62.4 the previous month.
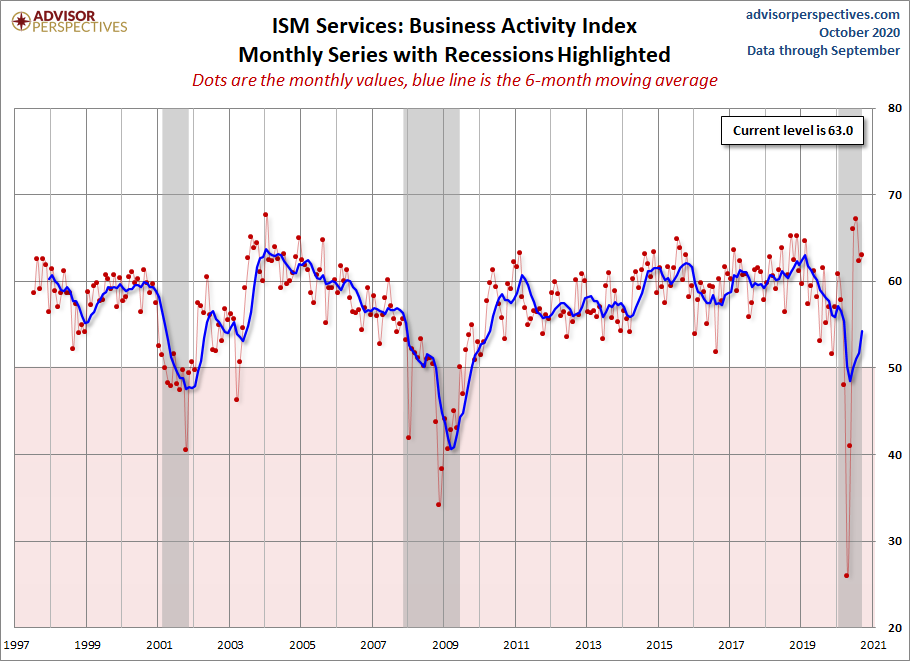
For a diffusion index, this can be an extremely volatile indicator, hence the addition of a six-month moving average to help us visualize the short-term trends.
Theoretically, this indicator should become more useful as the time frame of its coverage expands. Manufacturing may be a more sensitive barometer than Non-Manufacturing activity, but we are increasingly a services-oriented economy, which explains our intention to keep this series on the radar.
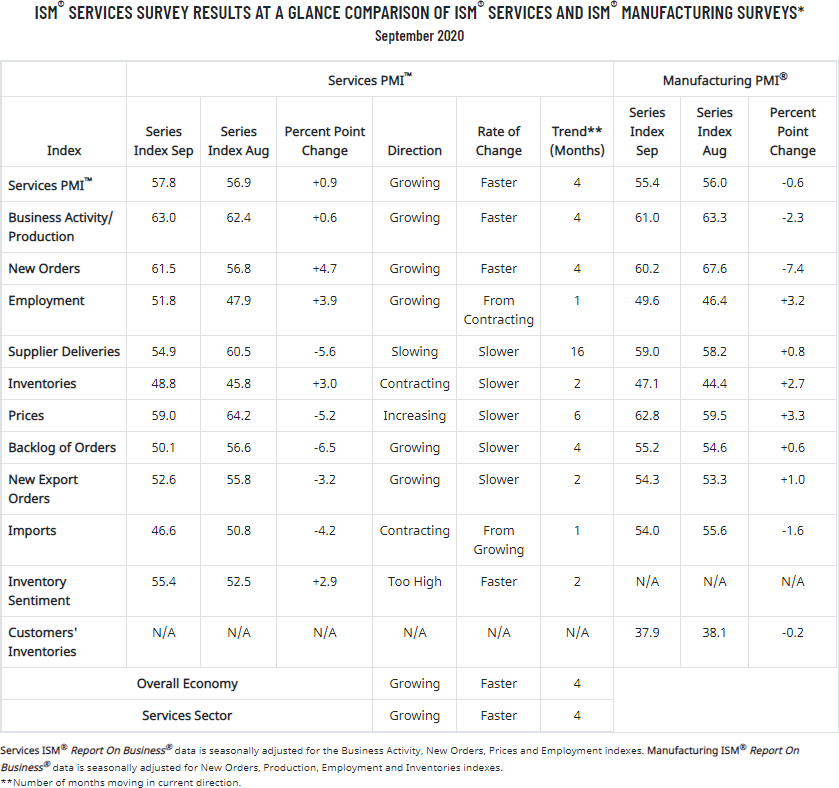
Here is a table showing the trend in the underlying components.


Comments
Log in or sign up to join the conversation.