
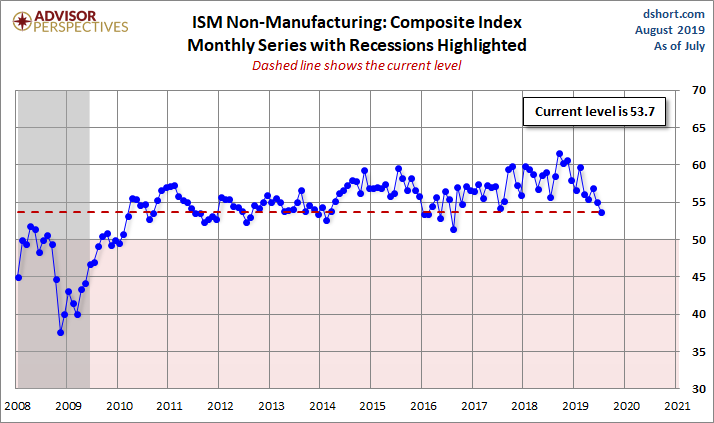
The Institute of Supply Management (ISM) has now released the July Non-Manufacturing Purchasing Managers' Index (PMI), also known as the ISM Services PMI. The headline Composite Index is at 53.7 percent, down 1.4 from 55.1 last month. Today's number came in below the Investing.com forecast of 55.5 percent.
Here is the report summary:
“The NMI® registered 53.7 percent, which is 1.4 percentage points lower than the June reading of 55.1 percent. This represents continued growth in the non-manufacturing sector, at a slower rate. This is the index’s lowest reading since August 2016, when it registered 51.8 percent. The Non-Manufacturing Business Activity Index decreased to 53.1 percent, 5.1 percentage points lower than the June reading of 58.2 percent, reflecting growth for the 120th consecutive month. The New Orders Index registered 54.1 percent; 1.7 percentage points lower than the reading of 55.8 percent in June. The Employment Index increased 1.2 percentage points in July to 56.2 percent from the June reading of 55 percent. The Prices Index decreased 2.4 percentage points from the June reading of 58.9 percent to 56.5 percent, indicating that prices increased in July for the 26th consecutive month. According to the NMI®, 13 non-manufacturing industries reported growth. The non-manufacturing sector’s rate of growth continued to cool off. Respondents indicated ongoing concerns related to tariffs and employment resources. Comments remained mixed about business conditions and the overall economy.” [Source]
Unlike its much older kin, the ISM Manufacturing Series, there is relatively little history for ISM's Non-Manufacturing data, especially for the headline Composite Index, which dates from 2008. The chart below shows the Non-Manufacturing Composite. We have only a single recession to gauge is behavior as a business cycle indicator.
The more interesting and useful subcomponent is the Non-Manufacturing Business Activity Index. The latest data point at 53.1 percent is down 5.1 from a seasonally adjusted 58.2 the previous month.
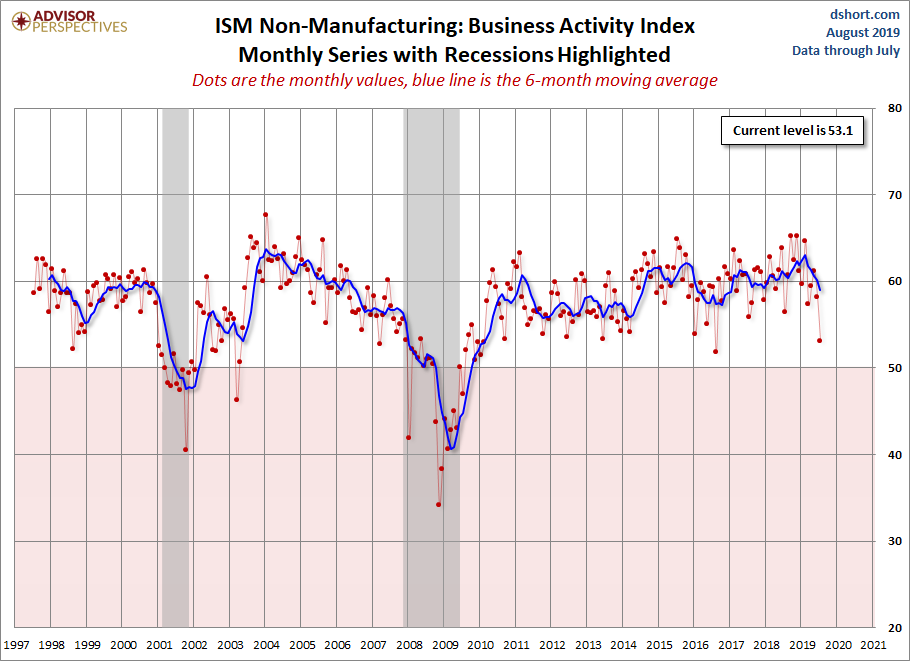
For a diffusion index, this can be an extremely volatile indicator, hence the addition of a six-month moving average to help us visualize the short-term trends.
Theoretically, this indicator should become more useful as the time frame of its coverage expands. Manufacturing may be a more sensitive barometer than Non-Manufacturing activity, but we are increasingly a services-oriented economy, which explains our intention to keep this series on the radar.
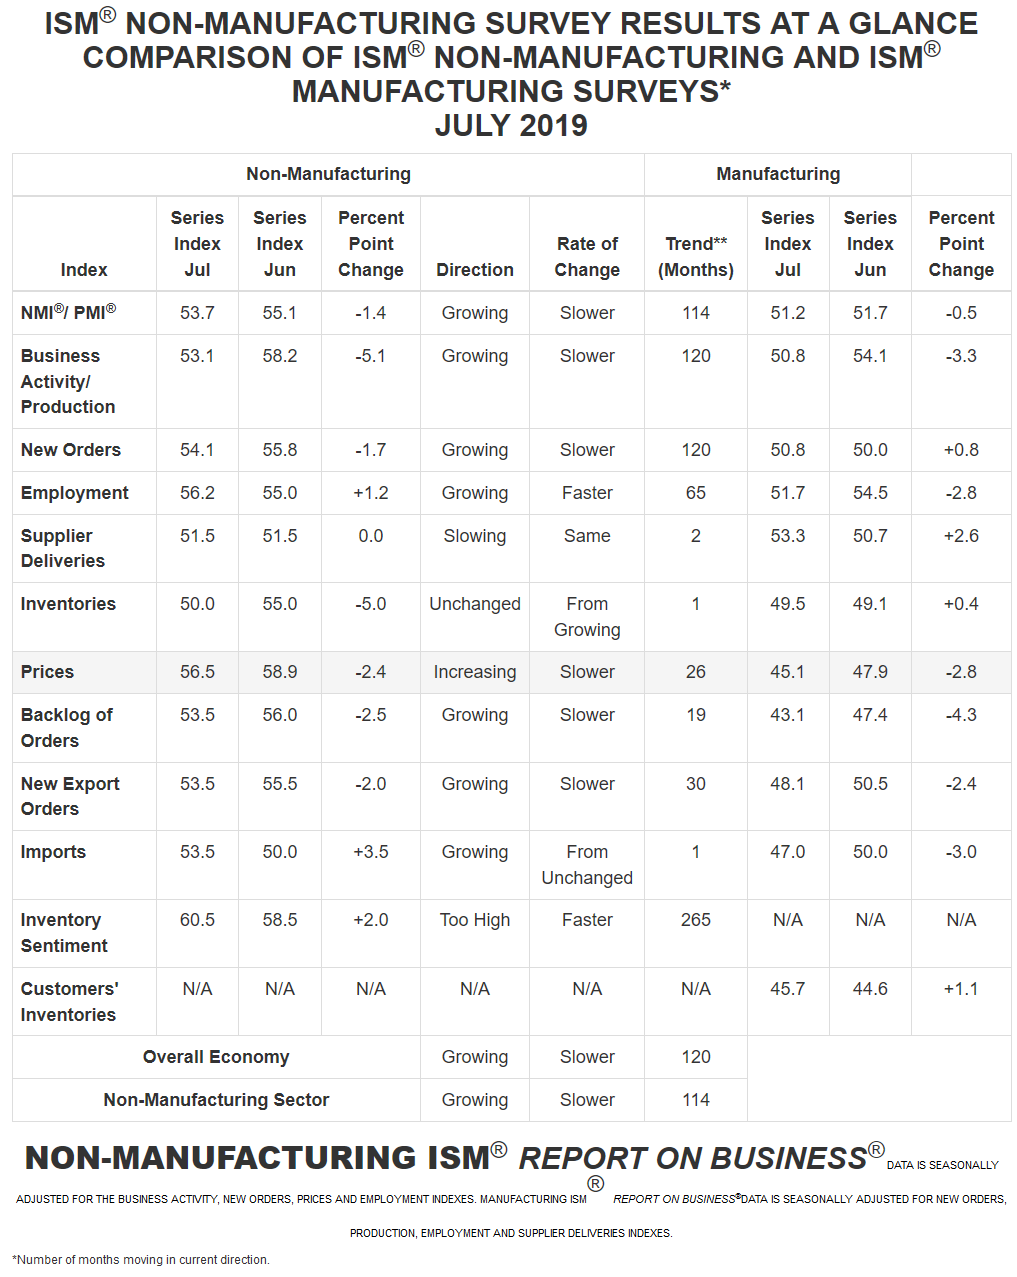
Here is a table showing the trend in the underlying components.
(Click on image to enlarge)


Comments
Log in or sign up to join the conversation.