
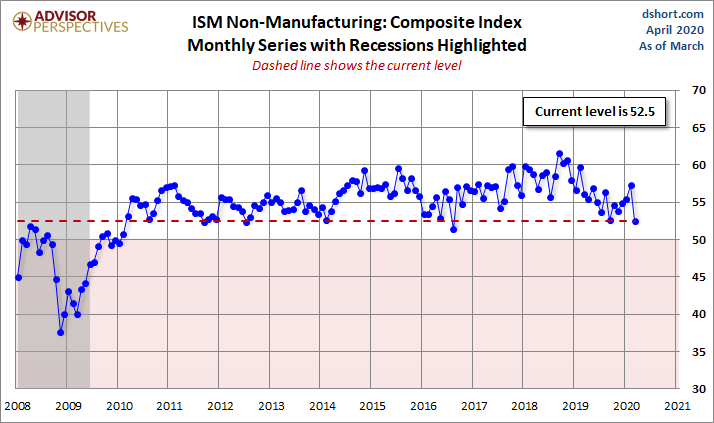
The Institute of Supply Management (ISM) has now released the March Non-Manufacturing Purchasing Managers' Index (PMI), also known as the ISM Services PMI. The headline Composite Index is at percent 52.5, down 4.8 from 57.3 last month. Today's number came in above the Investing.com forecast of 44.0 percent.
Here is the report summary:
"The NMI® registered 52.5 percent, 4.8 percentage points lower than the February reading of 57.3 percent. This represents continued growth in the non-manufacturing sector, at a slower rate. The Non-Manufacturing Business Activity Index decreased to 48 percent, 9.8 percentage points lower than the February reading of 57.8 percent, reflecting contraction for the first time since July 2009, when the index registered 47.2 percent. The New Orders Index registered 52.9 percent, 10.2 percentage points below the reading of 63.1 percent in February. The Employment Index decreased 8.6 percentage points to 47 percent from the February reading of 55.6 percent." [Source]
Unlike its much older kin, the ISM Manufacturing Series, there is relatively little history for ISM's Non-Manufacturing data, especially for the headline Composite Index, which dates from 2008. The chart below shows the Non-Manufacturing Composite. We have only a single recession to gauge is behavior as a business cycle indicator.
The more interesting and useful subcomponent is the Non-Manufacturing Business Activity Index. The latest data point at 48.0 percent is down 9.8 from a seasonally adjusted 57.8 the previous month.
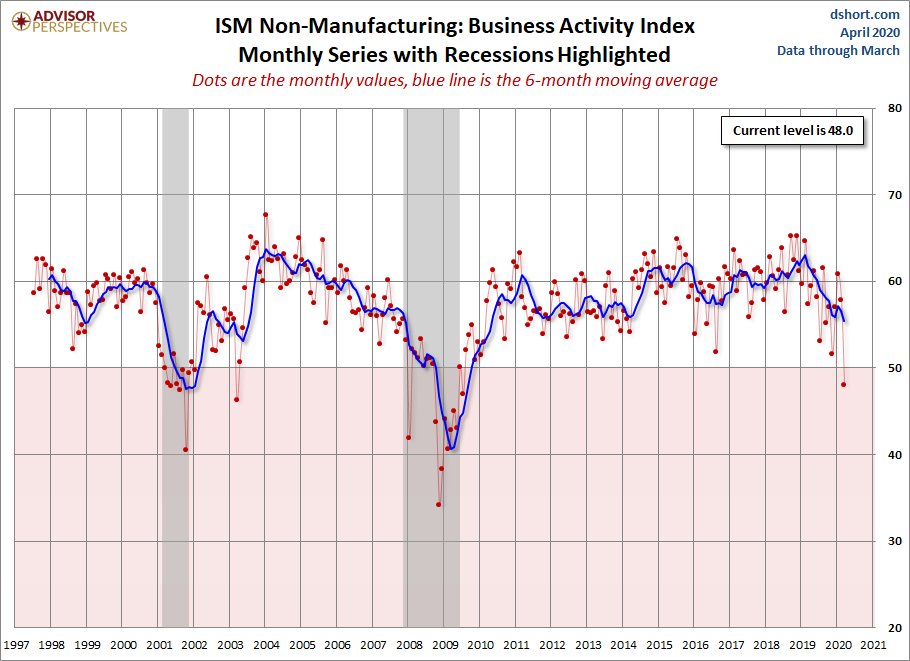
For a diffusion index, this can be an extremely volatile indicator, hence the addition of a six-month moving average to help us visualize the short-term trends.
Theoretically, this indicator should become more useful as the time frame of its coverage expands. Manufacturing may be a more sensitive barometer than Non-Manufacturing activity, but we are increasingly a services-oriented economy, which explains our intention to keep this series on the radar.
Here is a table showing the trend in the underlying components.
ISM® NON-MANUFACTURING SURVEY RESULTS AT A GLANCE COMPARISON OF ISM® NON-MANUFACTURING AND ISM® MANUFACTURING SURVEYS*
MARCH 2020
| Non-Manufacturing | Manufacturing | ||||||||
|---|---|---|---|---|---|---|---|---|---|
| Index | Series Index Mar | Series Index Feb | Percent Point Change | Direction | Rate of Change | Trend** (Months) | Series Index Mar | Series Index Feb | Percent Point Change |
| NMI®/ PMI® | 52.5 | 57.3 | -4.8 | Growing | Slower | 122 | 49.1 | 50.1 | -1.0 |
| Business Activity/ Production | 48.0 | 57.8 | -9.8 | Contracting | From Growing | 1 | 47.7 | 50.3 | -2.6 |
| New Orders | 52.9 | 63.1 | -10.2 | Growing | Slower | 128 | 42.2 | 49.8 | -7.6 |
| Employment | 47.0 | 55.6 | -8.6 | Contracting | From Growing | 1 | 43.8 | 46.9 | -3.1 |
| Supplier Deliveries | 62.1 | 52.4 | +9.7 | Slowing | Faster | 10 | 65.0 | 57.3 | +7.7 |
| Inventories | 41.5 | 53.9 | -12.4 | Contracting | From Growing | 1 | 46.9 | 46.5 | +0.4 |
| Prices | 50.0 | 50.8 | -0.8 | Unchanged | From Increasing | 1 | 37.4 | 45.9 | -8.5 |
| Backlog of Orders | 55.0 | 53.2 | +1.8 | Growing | Faster | 2 | 45.9 | 50.3 | -4.4 |
| New Export Orders | 45.9 | 55.6 | -9.7 | Contracting | From Growing | 1 | 46.6 | 51.2 | -4.6 |
| Imports | 40.2 | 52.6 | -12.4 | Contracting | From Growing | 1 | 42.1 | 42.6 | -0.5 |
| Inventory Sentiment | 47.8 | 59.3 | -11.5 | Too Low | From Too High | 1 | N/A | N/A | N/A |
| Customers' Inventories | N/A | N/A | N/A | N/A | N/A | N/A | 43.4 | 41.8 | +1.6 |
| Overall Economy | Growing | Slower | 128 | ||||||
| Non-Manufacturing Sector | Growing | Slower | 122 |


Comments
Log in or sign up to join the conversation.