
This morning the Institute for Supply Management published its monthly Manufacturing Report for May. The latest headline Purchasing Managers Index (PMI) was 43.1, an increase of 1.6 from 41.5 the previous month. Today's headline number was above the Investing.com forecast of 43.0 percent.
Here is the key analysis from the report:
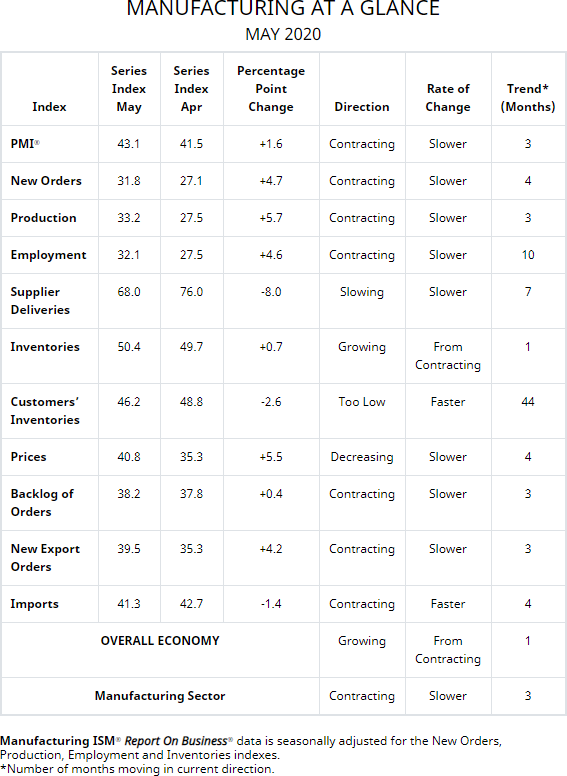
“The Inventories Index registered 50.4 percent, 0.7 percentage point higher than the April reading of 49.7 percent. The Prices Index registered 40.8 percent, up 5.5 percentage points compared to the April reading of 35.3 percent. The New Export Orders Index registered 39.5 percent, an increase of 4.2 percentage points compared to the April reading of 35.3 percent. The Imports Index registered 41.3 percent, a 1.4-percentage point decrease from the April reading of 42.7 percent.
“Three months into the manufacturing disruption caused by the coronavirus (COVID-19) pandemic, comments from the panel were cautious (two cautious comments for every one optimistic comment) regarding the near-term outlook. As was the case in April, the PMI® indicates a level of manufacturing-sector contraction not seen since April 2009; however, the trajectory improved. Demand contracted heavily again, with the (1) New Orders contracting at a strong level, again pushed by New Export Orders contraction; both indexes contracted at slower rates, (2) Customers’ Inventories Index returning to a level considered a positive for future production, and (3) Backlog of Orders Index remaining in strong contraction territory, in spite of weak production during the period. Consumption (measured by the Production and Employment indexes) contributed positively (a combined 10.3-percentage point increase) to the PMI® calculation, with many panelists classified as non-essential beginning to return to work in late May. Inputs — expressed as supplier deliveries, inventories and imports — strengthened again due to supplier delivery issues that were partially offset by continuing imports sluggishness. The delivery issues were the result of disruptions in domestic and global supply chains, driven primarily by supplier plant shutdowns. Inventory expanded due to issues with throughput and demand weakness. Inputs contributed negatively (a combined 7.3-percentage point decrease) to the PMI® calculation. (The Supplier Deliveries and Inventories indexes directly factor into the PMI®; the Imports Index does not.) Prices continued to contract (but at a slower rate in May), supporting a negative outlook.
“The coronavirus pandemic impacted all manufacturing sectors for the third straight month. May appears to be a transition month, as many panelists and their suppliers returned to work late in the month. However, demand remains uncertain, likely impacting inventories, customer inventories, employment, imports and backlog of orders. Among the six biggest industry sectors, Food, Beverage & Tobacco Products remains the only industry in expansion. Transportation Equipment; Petroleum & Coal Products; and Fabricated Metal Products continue to contract at strong levels,” says Fiore. See report
Here is the table of PMI components.
The chart below shows the Manufacturing Composite series, which stretches back to 1948. The eleven recessions during this time frame are indicated along with the index value the month before the recession starts.
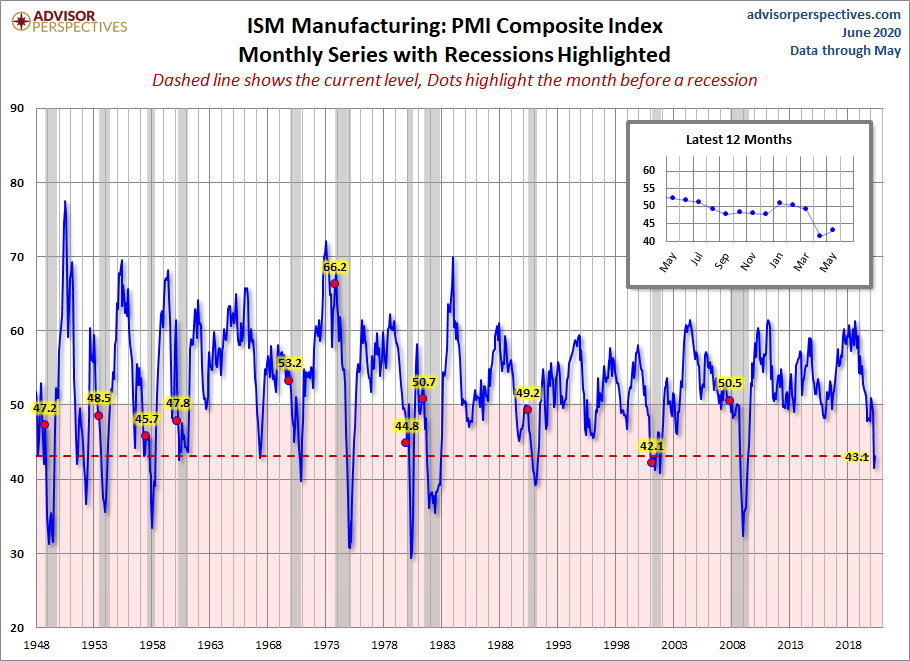
For a diffusion index, the latest reading is 43.1 and indicates contraction. What sort of correlation does that have with the months before the start of recessions? Check out the red dots in the chart above.
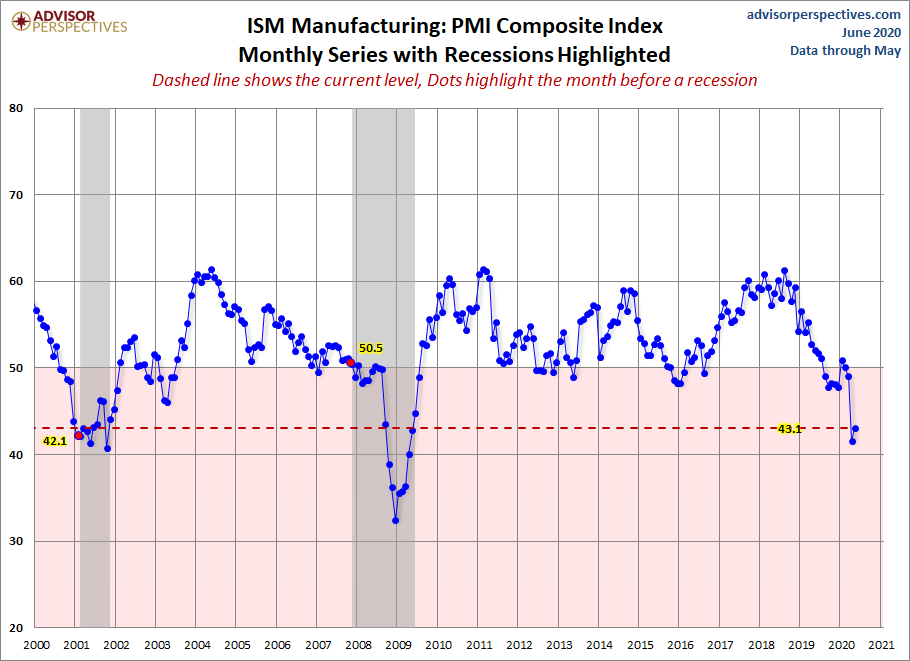
Here is a closer look at the series beginning at the turn of the century.
Note: This commentary used the FRED USRECP series (Peak through the Period preceding the Trough) to highlight the recessions in the charts above. For example, the NBER dates the last cycle peak as December 2007, the trough as June 2009, and the duration as 18 months. The USRECP series thus flags December 2007 as the start of the recession and May 2009 as the last month of the recession, giving us an 18-month duration. The dot for the last recession in the charts above is thus for November 2007. The "Peak through the Period preceding the Trough" series is the one FRED uses in its monthly charts, as illustrated here.


Comments
Log in or sign up to join the conversation.