
Today the Institute for Supply Management published its monthly Manufacturing Report for April. The latest headline Purchasing Managers Index (PMI) was 52.8 percent, a decrease of 2.5 percent from 55.3 the previous month. Today's headline number was below the Investing.com forecast of 55.0 percent.
Here is the key analysis from the report:
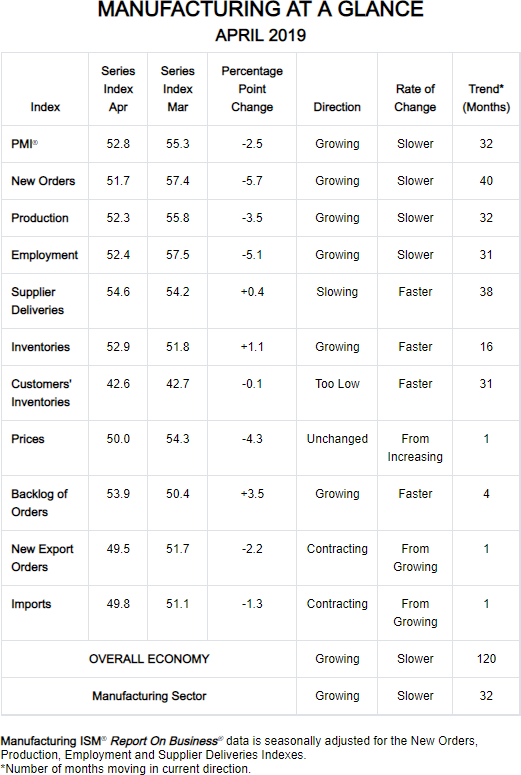
"The April PMI® registered 52.8 percent, a decrease of 2.5 percentage points from the March reading of 55.3 percent. The New Orders Index registered 51.7 percent, a decrease of 5.7 percentage points from the March reading of 57.4 percent. The Production Index registered 52.3 percent, a 3.5-percentage point decrease compared to the March reading of 55.8 percent. The Employment Index registered 52.4 percent, a decrease of 5.1 percentage points from the March reading of 57.5 percent. The Supplier Deliveries Index registered 54.6 percent, a 0.4-percentage point increase from the March reading of 54.2 percent. The Inventories Index registered 52.9 percent, an increase of 1.1 percentage points from the March reading of 51.8 percent. The Prices Index registered 50 percent, a 4.3-percentage point decrease from the March reading of 54.3 percent."
Here is the table of PMI components.
The chart below shows the Manufacturing Composite series, which stretches back to 1948. The eleven recessions during this time frame are indicated along with the index value the month before the recession starts.
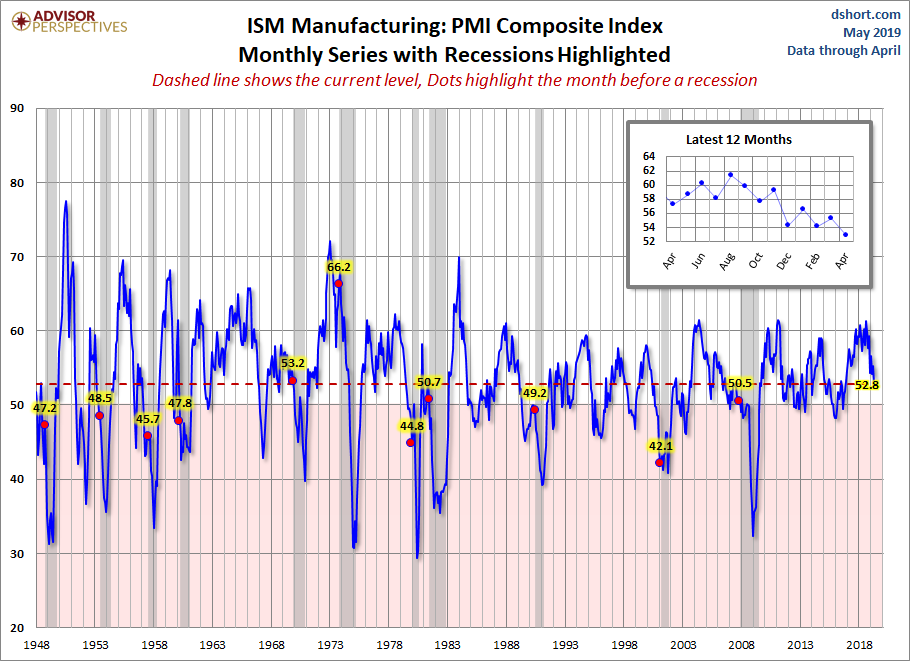
For a diffusion index, the latest reading of 52.8 is its 32nd consecutive month of expansion. What sort of correlation does that have with the months before the start of recessions? Check out the red dots in the chart above.
Here is a closer look at the series beginning at the turn of the century.
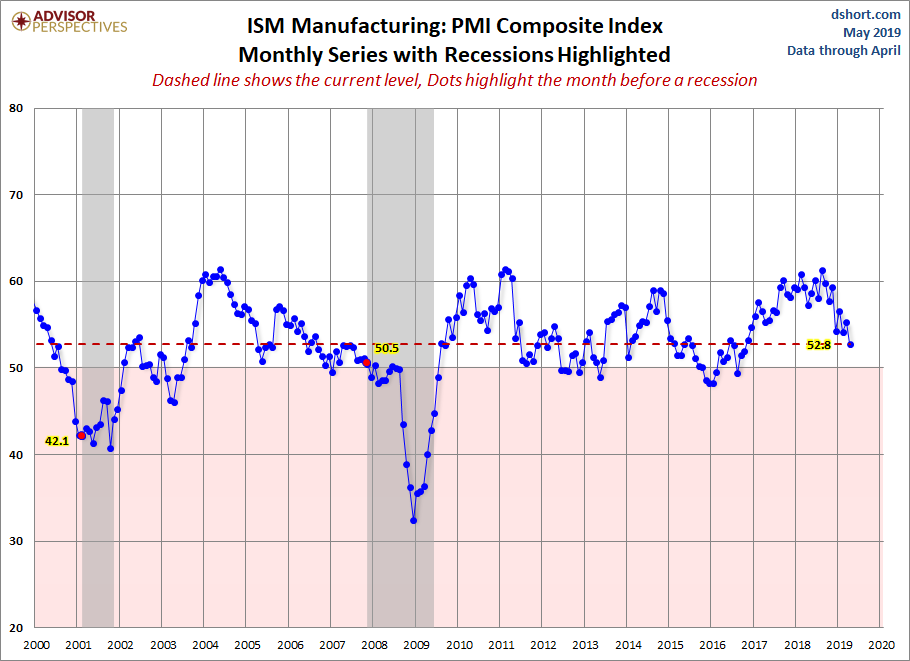
Note: This commentary used the FRED USRECP series (Peak through the Period preceding the Trough) to highlight the recessions in the charts above. For example, the NBER dates the last cycle peak as December 2007, the trough as June 2009 and the duration as 18 months. The USRECP series thus flags December 2007 as the start of the recession and May 2009 as the last month of the recession, giving us the 18-month duration. The dot for the last recession in the charts above is thus for November 2007. The "Peak through the Period preceding the Trough" series is the one FRED uses in its monthly charts, as illustrated here.


Comments
Log in or sign up to join the conversation.