
Today the Institute for Supply Management published its monthly Manufacturing Report for November. The latest headline Purchasing Managers Index (PMI) was 58.2 percent, a decrease of 0.5 percent from 58.7 the previous month. Today's headline number was slightly below the Investing.com forecast of 58.4 percent.
Here is the key analysis from the report:
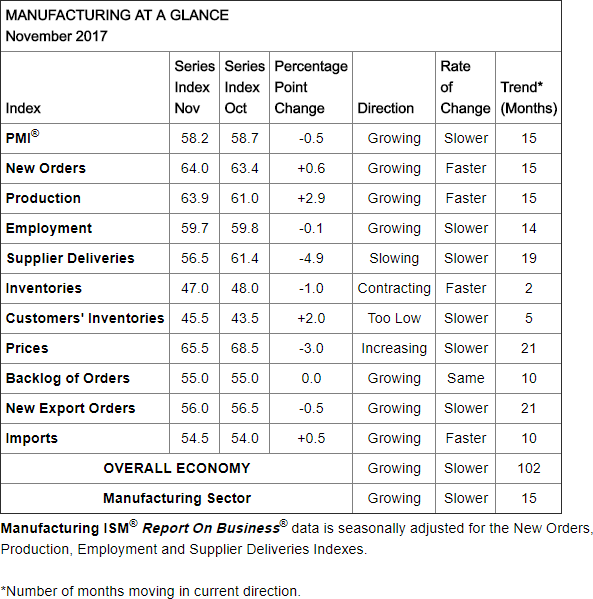
The report was issued today by Timothy R. Fiore, CPSM, C.P.M., Chair of the Institute for Supply Management® (ISM®) Manufacturing Business Survey Committee: "The November PMI® registered 58.2 percent, a decrease of 0.5 percentage point from the October reading of 58.7 percent. The New Orders Index registered 64 percent, an increase of 0.6 percentage point from the October reading of 63.4 percent. The Production Index registered 63.9 percent, a 2.9 percentage point increase compared to the October reading of 61 percent. The Employment Index registered 59.7 percent, a decrease of 0.1 percentage point from the October reading of 59.8 percent. The Supplier Deliveries Index registered 56.5 percent, a 4.9 percentage point decrease from the October reading of 61.4 percent. The Inventories Index registered 47 percent, a decrease of 1 percentage point from the October reading of 48 percent. The Prices Index registered 65.5 percent in November, a 3 percentage point decrease from the October level of 68.5, indicating higher raw materials prices for the 21st consecutive month. Comments from the panel reflect expanding business conditions, with New Orders and Production leading gains, employment expanding at a slower rate, order backlogs stable and expanding, and export orders all continuing to grow in November. Supplier deliveries continued to slow (improving), but at slower rates, and inventories continued to contract during the period. Price increases continued, but at a slower rate. The Customers’ Inventories Index improved but remains at low levels." [source]
Here is the table of PMI components.
The ISM Manufacturing Index should be viewed with a bit of skepticism for various reasons, which are essentially captured in a previous Briefing.com "Big Picture" comment on this economic indicator.
This [the ISM Manufacturing Index] is a highly overrated index. It is merely a survey of purchasing managers. It is a diffusion index, which means that it reflects the number of people saying conditions are better compared to the number saying conditions are worse. It does not weight for size of the firm, or for the degree of better/worse. It can therefore underestimate conditions if there is a great deal of strength in a few firms. The data have thus not been either a good forecasting tool or a good read on current conditions during this business cycle. It must be recognized that the index is not hard data of any kind, but simply a survey that provides broad indications of trends.
The chart below shows the Manufacturing Composite series, which stretches back to 1948. The eleven recessions during this time frame are indicated along with the index value the month before the recession starts.

For a diffusion index, the latest reading of 58.2 is its fifteenth consecutive month of expansion. What sort of correlation does that have with the months before the start of recessions? Check out the red dots in the chart above.
How revealing is today's 0.5 point change from last month? There are 839 monthly data points in this series. The absolute average month-to-month point change is 2.0 points, and the median change is 1.5 points.
Here is a closer look at the series beginning at the turn of the century.

To reiterate the Briefing.com assessment: "The data have thus not been either a good forecasting tool or a good read on current conditions during this business cycle." The ISM reports nevertheless offer an interesting sidebar to the ongoing economic debate.
Note: This commentary used the FRED USRECP series (Peak through the Period preceding the Trough) to highlight the recessions in the charts above. For example, the NBER dates the last cycle peak as December 2007, the trough as June 2009 and the duration as 18 months. The USRECP series thus flags December 2007 as the start of the recession and May 2009 as the last month of the recession, giving us the 18-month duration. The dot for the last recession in the charts above is thus for November 2007. The "Peak through the Period preceding the Trough" series is the one FRED uses in its monthly charts, as illustrated here.


Comments
Log in or sign up to join the conversation.