

Summary: There’s some blood in the streets now, but is it enough? Hedge funds have netted down hard. Net positioning is in the 0th percentile across multiple lookbacks, though gross exposure remains elevated. The bigger worry is retail, which keeps buying the dip while holding record equity allocations. On the plus side, breadth improved last week even as the index fell, and yields keep coming in. The risk is a considerable escalation in US and Israeli military action against Iran in the coming days and weeks, which is pushing oil higher and sapping risk appetite. All in all, this is still a low-conviction environment. Stay nimble, stay patient, and favor capital preservation over return generation. I’m looking for a tradeable tactical bottom in KOSPI, where pessimism is now well baked in, and I still like the setup in nat gas producers. Plus more…
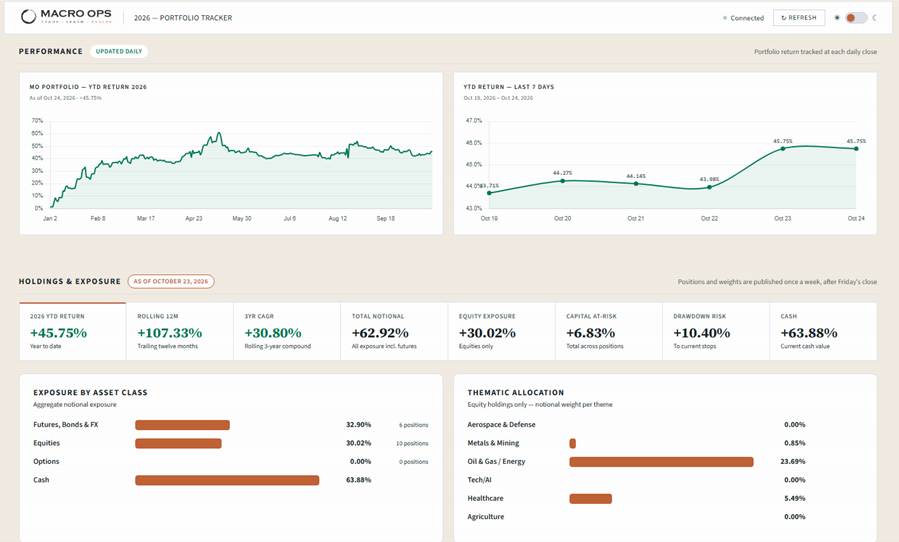
MO Portfolio & Trades
1. The portfolio rose +257bps last week and sits at +45.75% on the year, below our YTD high-water mark of +61%. We’re long Brent and heating oil futures, the BCOM Index, natural gas producers, a few miners and energy plays, and select biotech and healthcare plays. We’re short silver, soybeans, EUROSTOXX50, and continue to hold high levels of cash.
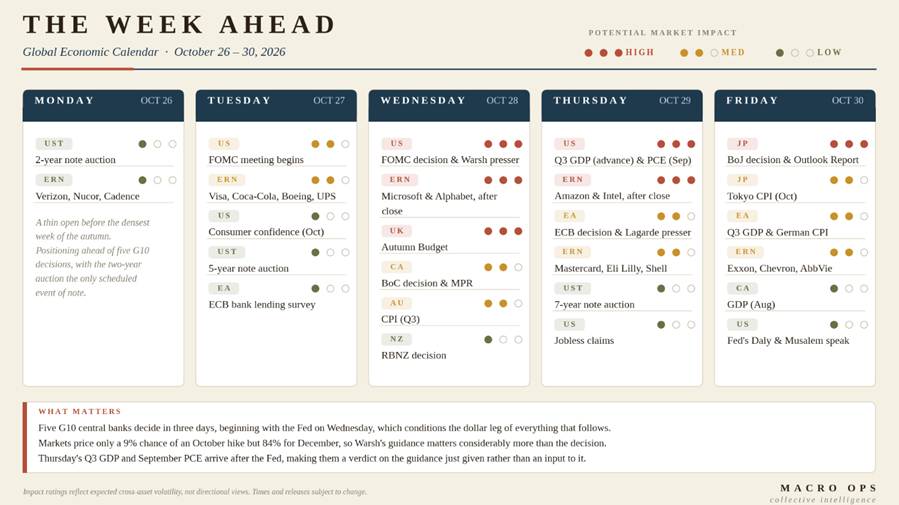
2. The week ahead in data. A BUSY week. Five G10 central banks decide in three days, starting with the Fed on Wednesday. Markets price only a 9% chance of an October hike but 84% for December, so Warsh’s guidance matters far more than the decision. Q3 GDP and September PCE land Thursday, after the Fed.
The 3Q26 earnings season enters its second week with ~25% of S&P 500 market cap (133 companies) reporting over the next seven days.
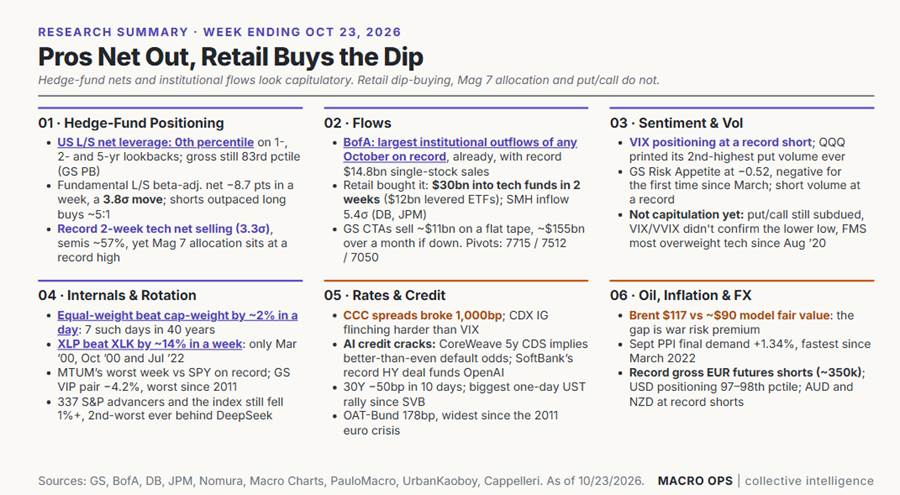
3. Research summary highlights: Hedge funds have cut net exposure to the lowest level in at least five years, and institutional October outflows are the largest on record. Retail investors bought the dip aggressively, Mag 7 allocations sit at record highs, and put/call ratios remain subdued, so positioning has washed out but fear has not yet reached capitulation. Underneath, the market is rotating at a pace seen only a handful of times in history: equal-weight and staples are sharply outperforming tech and momentum, while CCC spreads above 1,000bp, war-driven oil near $117 and record dollar longs add stress across asset classes.
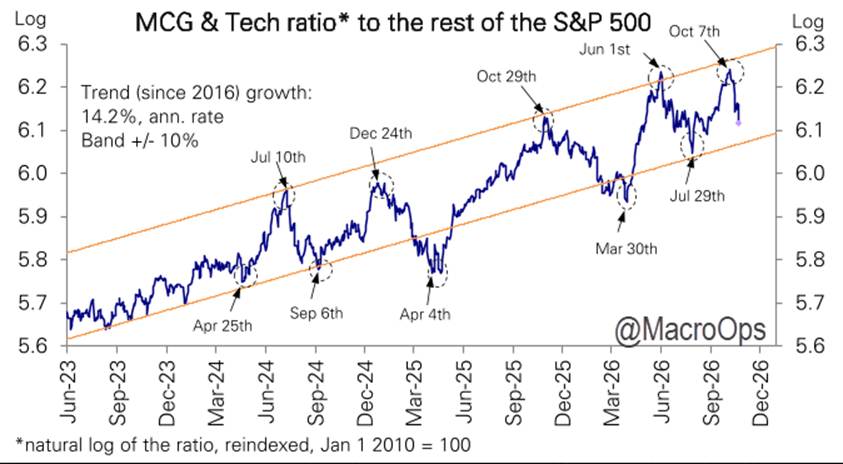
4. I shared this chart from JPM in these pages a few weeks back, making the case for a rotation out of tech. It’s played out to the T. The question now is whether tech’s underperformance overshoots the bottom of the lower channel. My guess is it does…
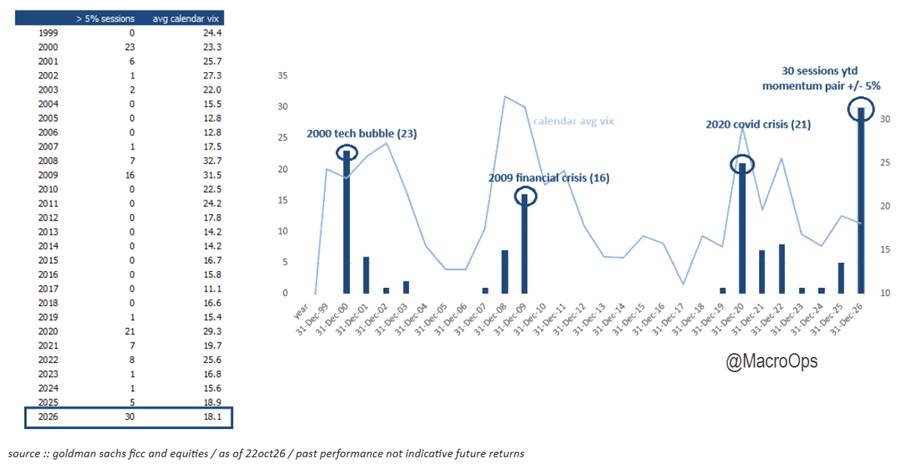
5. There’sno precedent via GS “fatigue setting in … cash and derivative volumes dried up into the weekend (this speaks to lower gross as well) …why are investors so tired? well, the amount of +/- 5% moves in the gs momentum factor year to date has no precedent (ytd count = 30, ticker gsprhimo) … it has outpaced 2000 tech bubble (23 occurrences w/ avg VIX 23), the financial crisis (16x occurrences w/ avg VIX 31), and the covid crisis (21x occurrences w/ avg VIX 29)
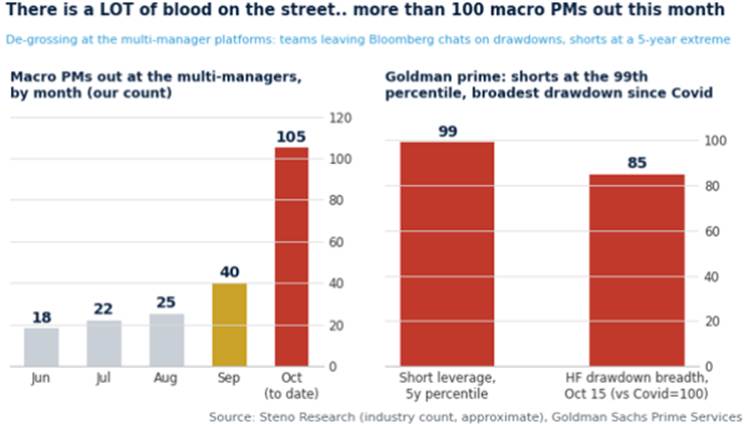
6. The unprecedented moves keep coming, and they’re taking their toll. This chart from Steno Research shows macro PMs getting dumped at record rates, while GS shows hedge fund drawdown breadth at its widest since the COVID lows.
That jibes with what I’m hearing from our network of HF managers. Many have given back all or more of their YTD gains, and plenty of them were up 30-40% on the year.
There are times to press and make money, and times to preserve capital. This remains the latter.
7. That said, I’m staying open to a tactical bounce soon. This positioning rinse is likely nearing its end. Some color from GS, emphasis mine:
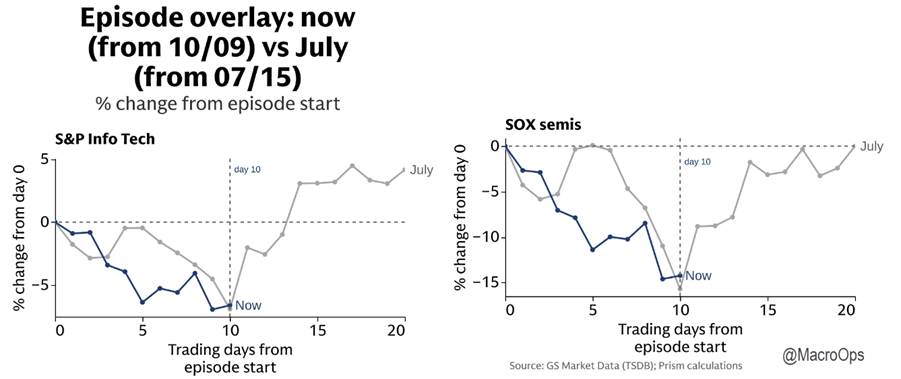
“Our floor has now seen approximately $20bn of TMT selling over the past two weeks, approaching the $23bn during July’s AI unwind. It’s hard not to make comparisons to July – we’ve seen almost identical moves in the parts of the market that have been under the greatest positioning pressure. The difference is that we’ve seen somewhat less pain at the index level, with SPX down 2.4% this time versus 3.4% in July.”
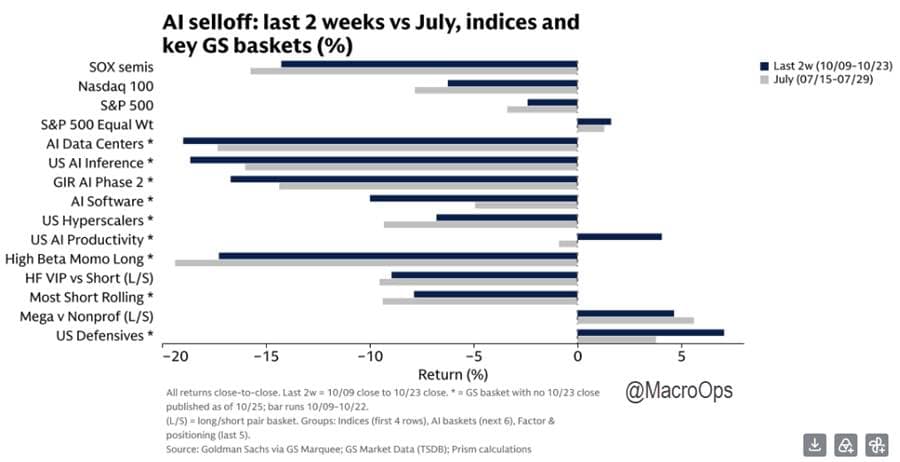
8. If we are tracking the July analog then we should be near a tactical low (charts via GS).
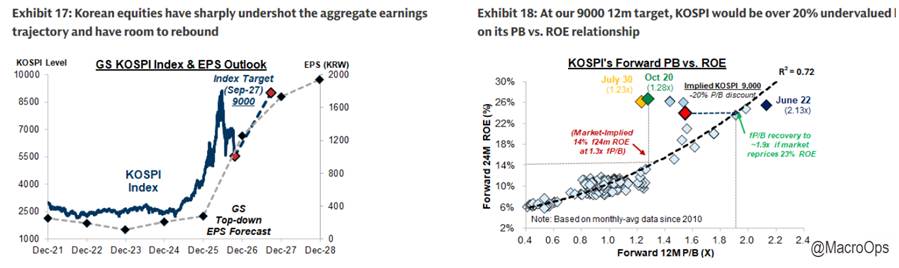
9. If coincident indicators start pointing to a tradeable low in AI names, one of my preferred ways to play it is KOSPI futures or the EWY ETF. Its 12m forward P/E is now 4x, 3 standard deviations below the mean, despite record profits.
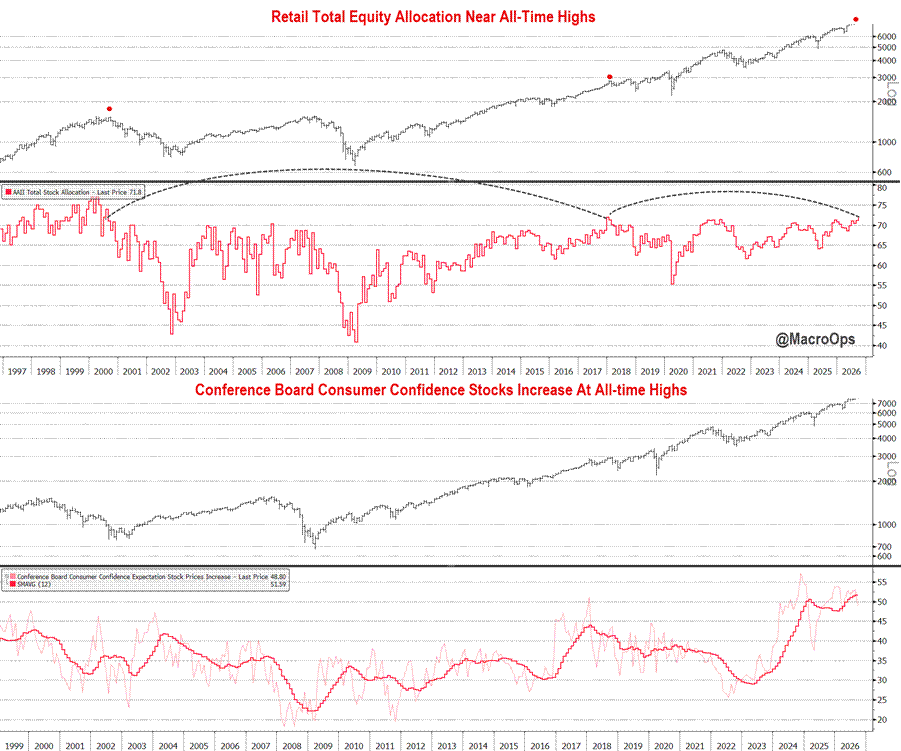
10. Despite HF’s netting down, retail keeps buying the dip and stuffing already-stuffed equity portfolios. AAII equity allocation is at levels last seen in Dec ‘17 and March ‘00, and the share of consumers expecting higher stock prices 12 months out is near an all-time high (h/t BBG’s Simon White).
The signs of a late cycle keep piling up. Late cycles are notoriously hard to trade. Chop, vol, and unusual cross-asset moves all pick up, and we’ve started to see plenty of that lately.
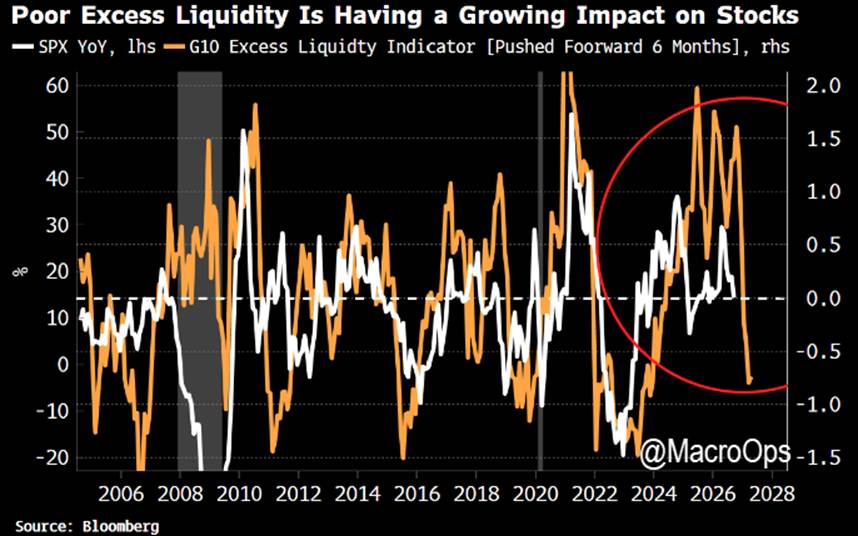
11. BBG’s Simon White notes that deteriorating liquidity points to a tough environment ahead for risk assets.
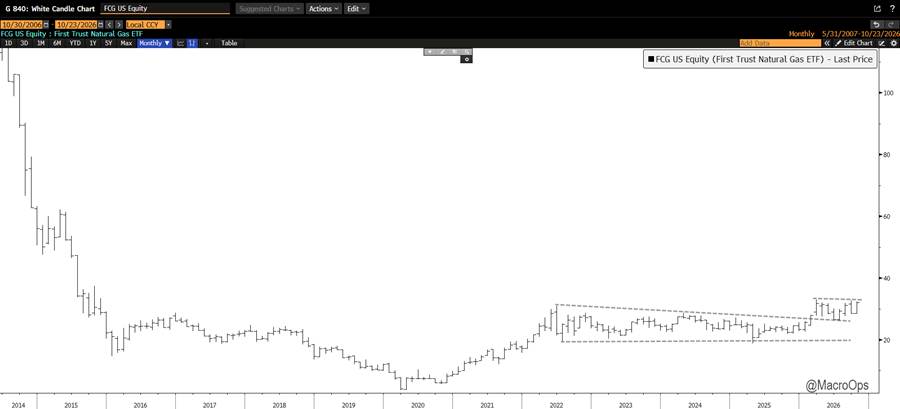
12. Honestly, I’m not seeing much to like right now. One setup though that keeps showing promise is the natural gas producers ETF (FCG), which I first flagged in September. The monthly chart shows price compressing in a tight sideways channel. With global gas prices rising, I think FCG could break out and run soon. We’re long and will be adding soon.
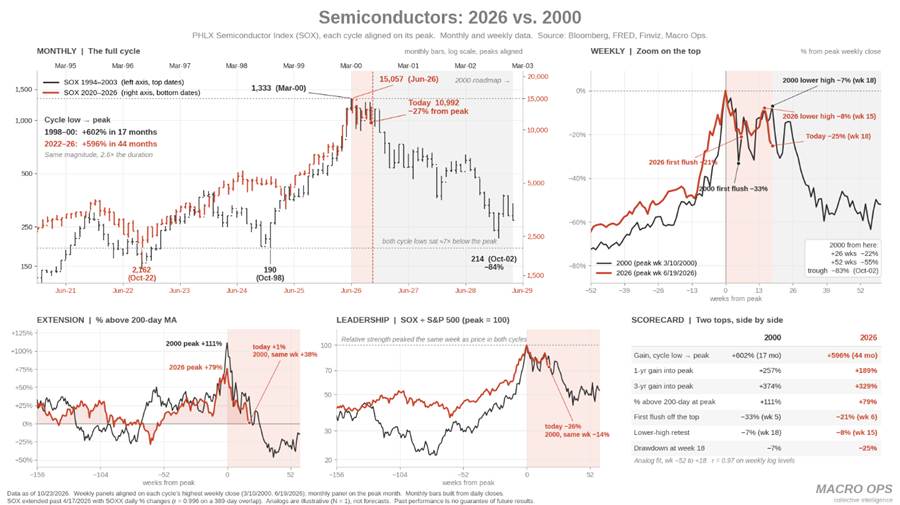
13. Semis today vs. the ‘00 top.

Comments
Log in or sign up to join the conversation.