

(Click on image to enlarge)
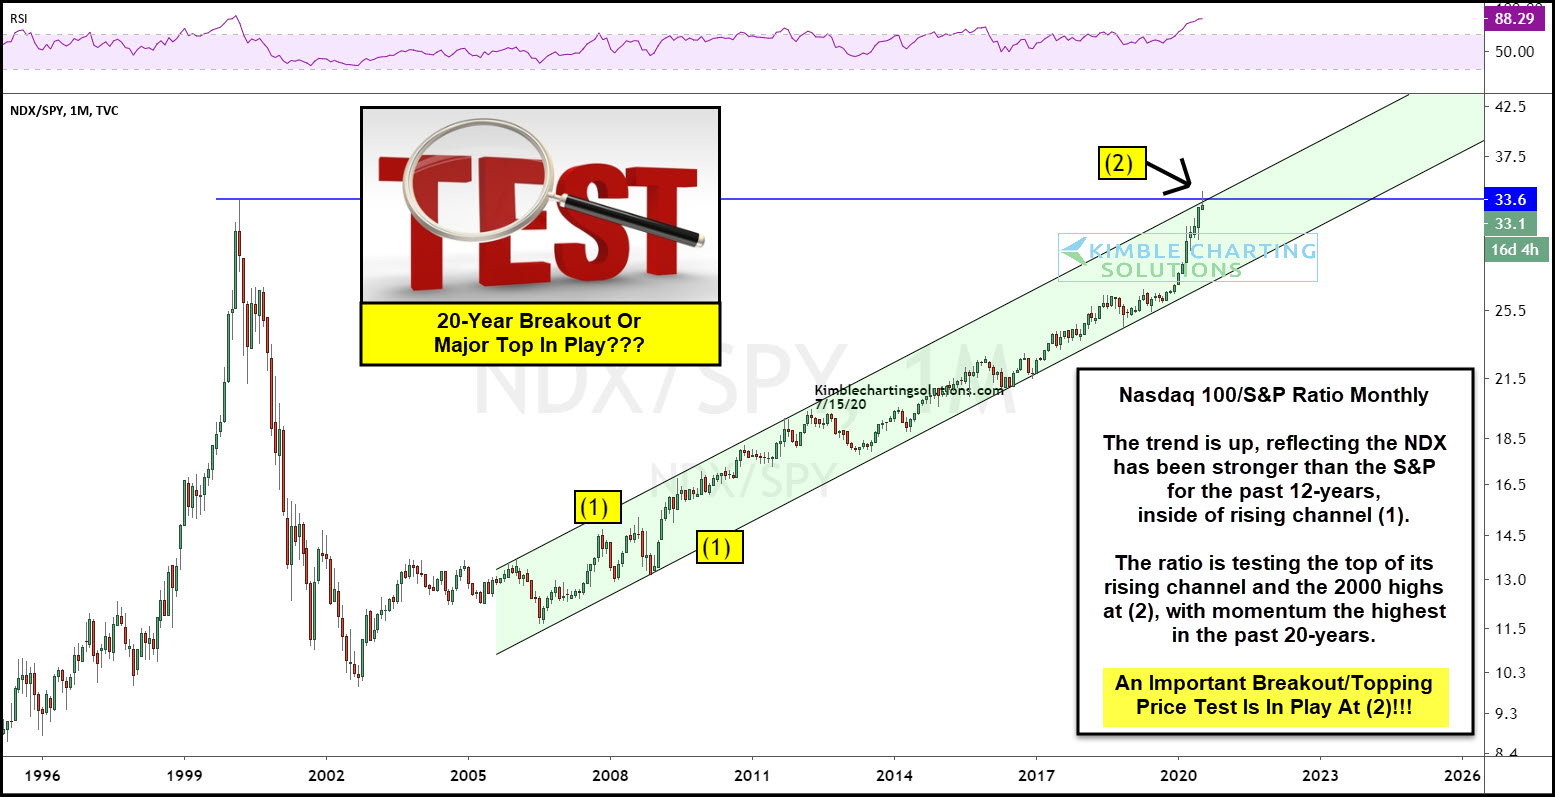
In today’s chart, we look at the Nasdaq 100 to S&P 500 performance ratio in an effort to answer the question: Is the ramp higher in tech stocks and severe out-performance sustainable?
While we may not be able to answer that question today, the ratio IS at an inflection point. And following today’s ratio chart should help us answer that question.
As a reminder, the ratio rises when the Nasdaq 100 is out-performing the S&P 500. Note also that it is a longer-term “monthly” price chart.
Important Breakout/Topping Price Test Is In Play!
As you can see, it’s been outperforming by a wide margin. Note the 20-year up-trend channel (green shaded) marked by each (1).
The ratio is now testing the top of the channel as well as the 2000 highs at (2). This breakout test comes as momentum is at the highest level in 20-years



Comments
Log in or sign up to join the conversation.