

Making Sense:
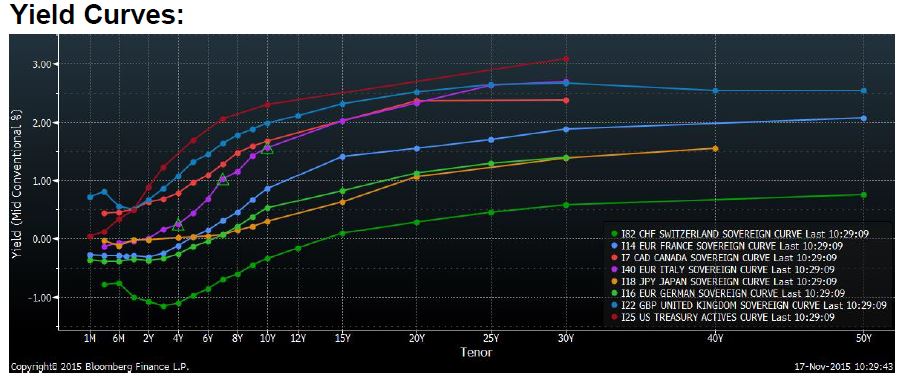
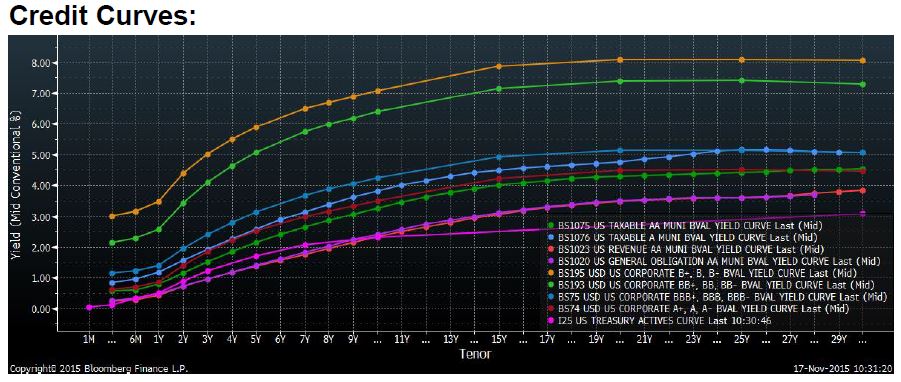
The lack of fixed income market understanding in the financial world is astounding. The comments I have heard and read from individuals one would assume to be knowledgeable is, in my opinion, quite disturbing. One of the more common unknowledgeable questions I hear asked is: Why is the long and of the yield curve not pricing in a Fed tightening?
(Click on image to enlarge)
(Click on image to enlarge)
(Click on image to enlarge)
Are You Experienced? (Have you ever been experienced?)
Really, the long end of the curve is not pricing in a Fed tightening? Let’s consider what the long end of the curve has done the past two weeks. The yield of 10-year UST note rose to 2.34% on 11/9/15 from a recent low of 2.02% on 10/21/15. This followed economic data which augured for the sustainability of U.S. economic growth and a more hawkish than expected FOMC statement (due mainly to a moderate rebound in economic data). At the time of this writing, the yield of the 10-year UST note stood at 2.30%. In my opinion, long-term interest rates (UST yields) reacted as expected given the data and Fed statement. The problem is not the bond market’s reaction, but expectations among pundits, investors and (sadly) investment professionals.
There is a mistaken belief that a Fed tightening augurs for higher rates across the yield curve. As I discussed in the 11/15/15 “In the Trenches” report, both Fed policy and long-term interest rates respond to the same stimuli, higher inflation rates/expectations. However, because the bond market can (and often does) act much more quickly in response to economic data, long-term rates often rise before the Fed tightens. Late last month we had stronger Personal Consumption, Nonfarm Payrolls and Average Hourly Earnings data, all potentially inflationary. The long end of the UST curve responded immediately by trending higher. Financial media sources reported that some institutional bond market positions began shorting the long end of the UST curve late last month. This was almost certainly due to the fairly strong (inflationary) economic data.
What I am trying to say is; unless we see even more pro-inflationary data, the long end of the UST curve has already accounted for conditions which will permit the Fed to lift off in December. I.E. The Fed will probably have to play catch-up to the bond market. This is not unusual. The typical trend is:
- The yield curve steepens as long rates move higher on economic data.
- The Fed, typically slow to respond, begins tightening. For a short period of time, all rates move higher.
- The Fed catches up and often overshoots. The yield curve steepening slows, goes flat and eventually inverts as the Fed overshoots, and is slow to ease.
I believe that, unless we see a sharp increase in inflation pressures, much, if not all, of the curve steepening phase has already occurred. We could see a brief period in which all rates move higher, but that probably does not take the 10-year to 3.00% (possibly not even to 2.75%). After this, the curve should start to flatten noticeably.
Hot Tuna
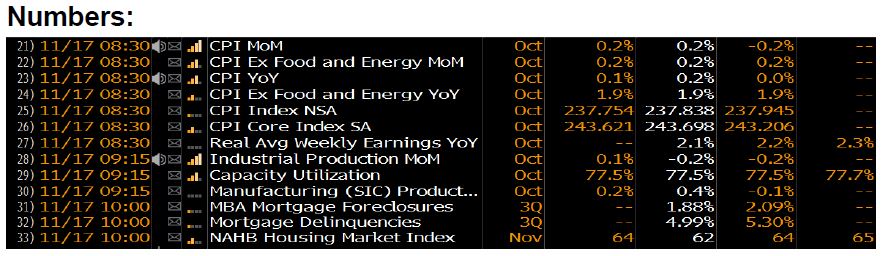
Today’s economic data paint a clear picture of the bifurcated U.S. economy. CPI YoY came in at 0.2%, up from a prior 0.0% and higher than the Street consensus of 0.1%. Yes, this is annual inflation. However, backing out food and energy, Core CPI came in at 1.9%, unchanged from the prior report and in line with the Street consensus estimate. On the surface, all looks encouraging with regard to inflation. However, there are some trends which bear noting.
We all know that plunging energy and commodities prices have helped to hold down headline inflation. However, the October data reported a monthly 0.3% increase in energy prices. Given the plunge in energy prices since the survey was taken, it is doubtful that we see a repeat in November. The data indicate disinflation/deflation in the goods side of the economy. According to the data, inflation in the service side of the economy is over 2.0% YoY. As the service sector is responsible for the vast majority of U.S. economic activity, this might indicate economic strength. However, much of the non-goods inflation occurred in healthcare and rents.
The two-speed economy was also reflected in today’s Industrial Production and Capacity Utilization data. Capacity Utilization for October printed at 77.5%, down from a prior revised 77.7% (up from 77.5%) and in line with the Street consensus estimate.

Comments
Log in or sign up to join the conversation.