

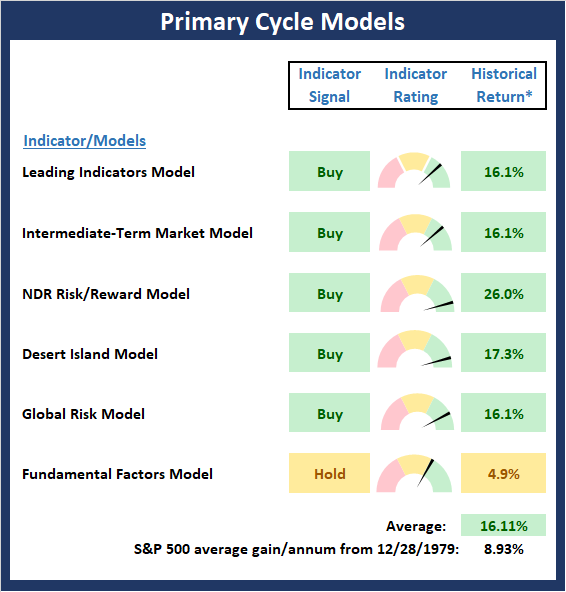
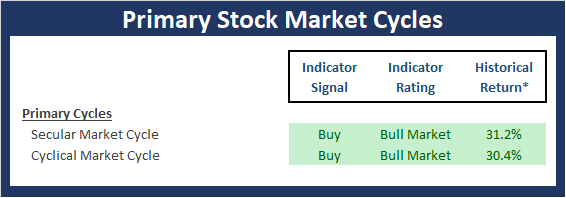
As a reminder, the market's primary cycles generally do not change often. However, I still like to start each week with a clear understanding of what type of market we are dealing with. For me, a quick glance at the color of the Primary Cycle board and the weekly/monthly S&P graphs below tells me an awful lot about the "state" of the key market cycles.
My Current Take...
There are no changes to the Primary Cycle board this week. And with the board predominately green it is easy to argue that the bulls are large and in charge. But my biggest question/concern from a big-picture point of view is if the bullish argument is getting a little "too easy" to make these days!
(Click on image to enlarge)
* Source: Ned Davis Research (NDR) as of the date of publication. Historical returns are hypothetical average annual performances calculated by NDR. Past performances do not guarantee future results or profitability - NOT INDIVIDUAL INVESTMENT ADVICE.
Checking In On The "Primary" Cycles
While I don't often make portfolio adjustments based on the long-term trends in the stock market (aka the "primary cycles"), I have found over the years that checking in on state of the cycles and the weekly/monthly charts helps to keep the big-picture in perspective.
(Click on image to enlarge)
* Source: Ned Davis Research (NDR) as of the date of publication. Historical returns are hypothetical average annual performances calculated by NDR. Past performances do not guarantee future results or profitability - NOT INDIVIDUAL INVESTMENT ADVICE.
The Secular Market Cycle
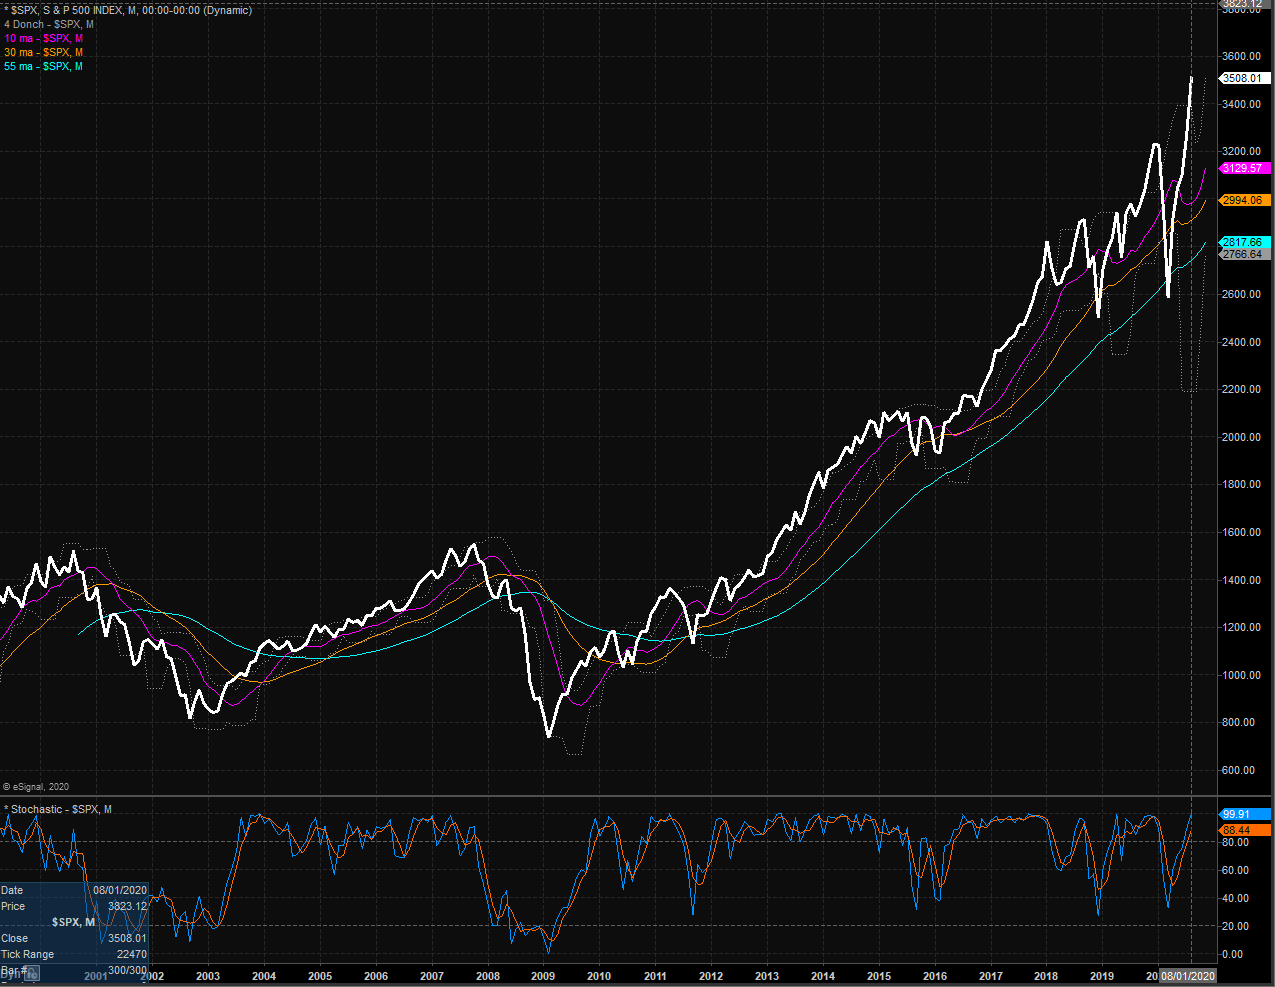
Definition: A secular bull market is a period in which stock prices rise at an above-average rate for an extended period (think 5 years or longer) and suffer only relatively short intervening declines. A secular bear market is an extended period of flat or declining stock prices. Secular bull or bear markets typically consist of multiple cyclical bull and bear markets. Below is a monthly chart of the S&P 500 Index illustrating the current cycle, which we estimate began on March 9, 2009.
S&P 500 - Monthly
(Click on image to enlarge)
The Cyclical Market Cycle
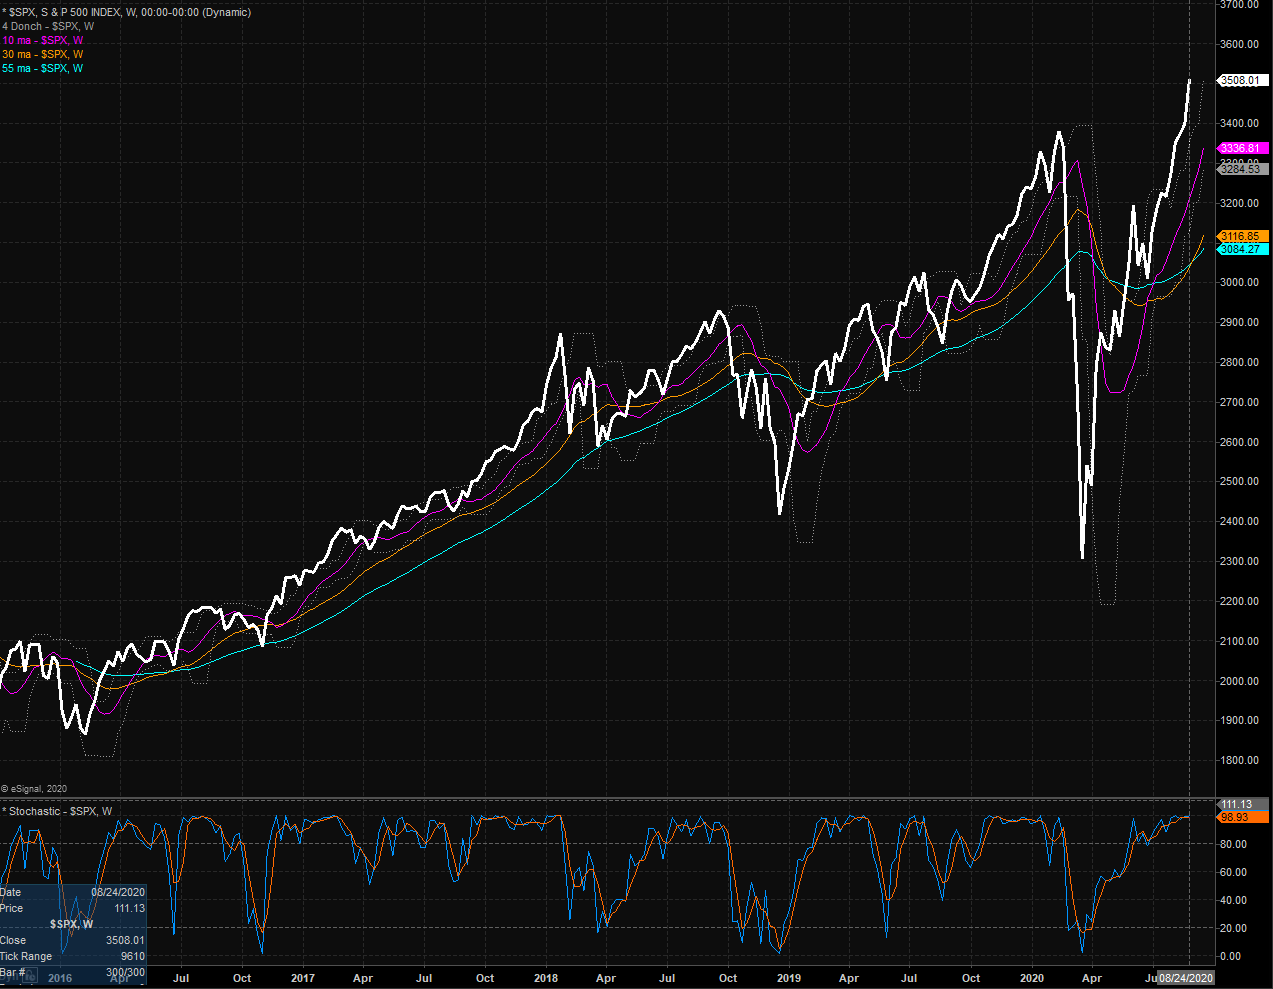
Definition: A cyclical bull market requires a 30% rise in the DJIA after 50 calendar days or a 13% rise after 155 calendar days. Reversals of 30% in the Value Line Geometric Index since 1965 also qualify. A cyclical bear market requires a 30% drop in the DJIA after 50 calendar days or a 13% decline after 145 calendar days. Reversals of 30% in the Value Line Geometric Index also qualify. Below is a weekly chart of the S&P 500 illustrating the current cycle, which we estimate began on March 24, 2020.
S&P 500 - Weekly
(Click on image to enlarge)
Summing Up
In summary, my key market models, which have been designed to tell me what type of big-picture market cycle we are dealing with - and models that I've been working with for many, many years - remain in good shape. However, from a near-term perspective, I worry that the "argument" to stick with the bulls is becoming a little too easy to make. Especially when everyone under the sun is now trading in their Robinhood accounts and looking for the next big score. As such, while the bulls remain in control of the game, some sort of pullback, correction, or consolidation phase would seem to make some sense in the coming weeks.



Comments
Log in or sign up to join the conversation.