

We've been talking lately about the idea that big hedge funds and systematic traders have been caught on the wrong side of the stock market's recent run for the roses. The thinking is this fact alone could account for the lack of downside volatility and the relentless dip-buying that has been occurring this year. And since there have been no real declines to speak of in 2019, some argue that the current trend can continue.
For example, there was a lot of talk last week about stocks "melting" higher in a slow and steady fashion from here. BlackRock's Larry Fink kicked things off by suggesting that there is a greater risk of a melt-up than a meltdown. Fink opined that the rally in stocks, which he points out is global in scope, may have further to go due to the record amount of cash on the sidelines and the fact that rates are not moving in the direction that had been expected.
Fink argues that many investors were looking for rates to rise this year as central banks around the world either continued or began to hike rates. But with global central bankers having pivoted to recognize slowing economic growth, investors have been forced to charge back into bonds. This has resulted in rates falling/bond prices rising and our indicators suggest that the bond market has become overbought and extended from a valuation perspective. The head of the world's largest money manager further suggests that this has created a "shortage of good assets" for investors, which "could ignite a melt-up in the global equity market."
From my seat, this view makes sense as I have long been a proponent of the idea that the money flows are one of the primary drivers of stock prices. And since the beginning of time, when too many dollars are chasing too few goods, prices tend to rise over time.
It is also worth noting that the backdrop for stocks looks to be improving. Not in the way that the tax cuts caused in 2017. But in a more subtle, more sustainable way.
Green Shoots
For example, if you look hard enough, you may see that there are some "green shoots" in the global economy starting to poke through. While the news/data hasn't been overtly positive, it is encouraging to see that global manufacturing PMI's have stopped falling, that the global OECD leading indicator was unchanged last month after thirteen straight months of decline, and that NDR's Global Recession Probability Model moved lower last month for the first time in nine months.
Earnings Recession? What Earnings Recession?
Next up, the much ballyhooed "earnings recession" may be over before it began - or may be priced in already. The bottom line is that while the earnings season is still young, the results have been a bit better than expected.
Doing Just Fine, Thank You
In addition, it appears the demise of the U.S. economy has been overstated. While the Atlanta Fed's GDPNow model had been projecting a paltry gain of just 0.3% for US GDP a couple of months back, the projection now stands at a healthy 2.8%. It turns out that consumers like to spend and that unless there is an impending crisis not to do so, Mr. and Mrs. John Q. Public will keep shopping for stuff. And since more than 70% of the U.S. economy is driven by consumption, well, you get the idea.
China Stimulating
Looking around the globe, it is also positive that the Chinese are stimulating their economy again. I won't bore you with all the measures being taken, but investors need to remember that China is a managed economy and that officials aren't likely to stand by and let the world's second-largest economy founder for too long before taking action.
Sideways For Some Time Now
And finally, from a big-picture perspective, it is important to keep in mind that while the action has been hot and heavy at times, stocks have effectively gone nowhere since the beginning of 2018. Yet, earnings grew by 21.75% in 2018 and are expected to be 32.5% higher than they were at the end of 2017 by the time New Years Eve 2019 rolls around.
Now consider that the S&P 500 has advanced just 8.6% since the end of 2017 and it is fairly easy to argue that there is plenty of room for additional upside. In fact, if you apply the same multiple that was in place in early 2018 to consensus Operating Earnings expectations for this year (currently at $164.99) my calculator suggests 3500 on the S&P within the next year or so isn't an unrealistic expectation.
Granted, I am talking about the big picture here and it goes without saying that a garden-variety correction could occur at any time and for almost any reason. But my guess is that any meaningful correction will continue to be bought in the near-term.
The Takeaway
So, as long as big money continues to seek a home, the economy continues to grow, and corporate America continues to do what it does best - make money, I'm of the mind that the path of least resistance for the primary trend of the stock market could continue to move from the lower left to the upper right and that the term "melt-up" may be the best way to describe the market environment.
Weekly Market Model Review
Now let's turn to the weekly review of my favorite indicators and market models...
The State of the Big-Picture Market Models
I like to start each week with a review of the state of my favorite big-picture market models, which are designed to help me determine which team is in control of the primary trend.

The Bottom Line:
- The primary change to the "Primary Cycle" board this week was the improvement in my "Desert Island" Model - better late than never, right? The bottom line here is with the exception of the Intermediate-Term Market Model, which is fretting about overbought conditions, the rest of the models suggest that one should stay seated on the bull train.
This week's mean percentage score of my 6 favorite models advanced to 74.6% from 58% last week (Prior readings: 49.5%, 47%, 50%, 47.9%, 45.4%, 40.3%) while the median improved to 81.5% from 65.9% last week (Prior readings: 50%, 50%, 50%, 50%, 46.3%, 42.5%).
The State of the Trend
Once I've reviewed the big picture, I then turn to the "state of the trend." These indicators are designed to give us a feel for the overall health of the current short- and intermediate-term trend models.
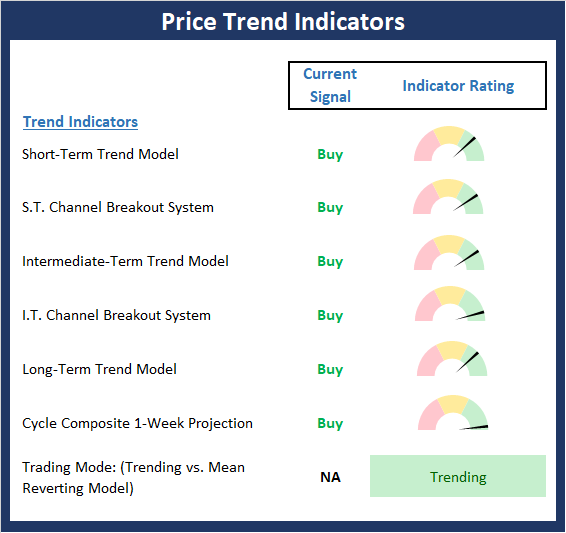
The Bottom Line:
- The Price Trend board continues to sport a perfect 10.0 reading (for the third consecutive week). However, the price action suggests that the bulls may be taking a bit of a breather here. But so far at least, the bears have not been able to make use of the pause in the upside action.
The State of Internal Momentum
Next up are the momentum indicators, which are designed to tell us whether there is any "oomph" behind the current trend.

The Bottom Line:
- While the Momentum board can no longer boast a perfect 10.0 score, it remains in pretty good shape. From my seat, the pullback in some of the shorter-term model readings is reflective of a pause in the upside action. As such, a pullback of the garden-variety would not be surprising.
The State of the "Trade"
We also focus each week on the "early warning" board, which is designed to indicate when traders might start to "go the other way" -- for a trade.
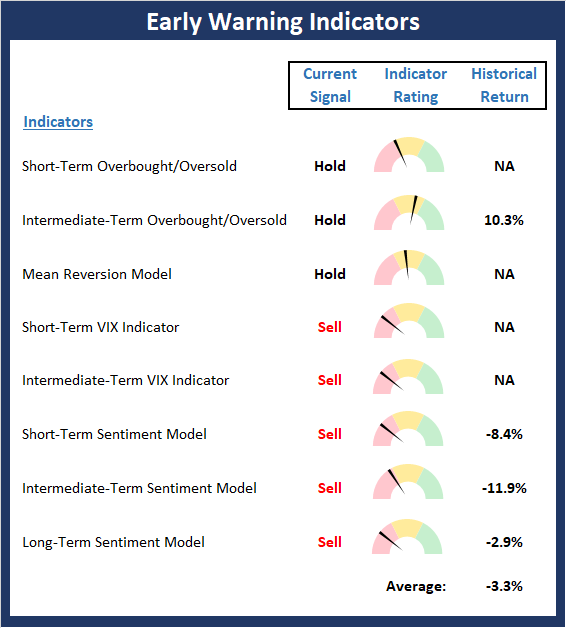
The Bottom Line:
- The Early Warning board is now waving its yellow warning flag as the table appears to be set for some sort of pullback/corrective action. However, given the strength of the recent trend, the bears will likely need some sort of a trigger to wrestle control from their opponents.
The State of the Macro Picture
Now let's move on to the market's fundamental factors - the indicators designed to tell us the state of the big-picture market drivers including monetary conditions, the economy, inflation, and valuations.
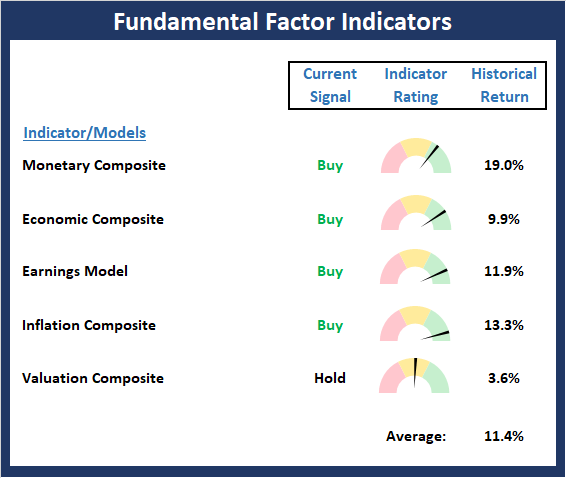
The Bottom Line:
- The Fundamentals board continued to improve this week. This time, the economic model ticked higher. My take is this confirms the narrative that economic fears have been overblown. In short, the Fundamental board continues to favor the bulls.



Comments
Log in or sign up to join the conversation.