
Several commodities have been on a tear higher over the past 18 months. This list of commodities includes crude oil.
As a key economic input, crude oil is more than just a tradable asset. Crude oil is an excellent indicator for the economy as well as a commodity to watch regarding inflation.
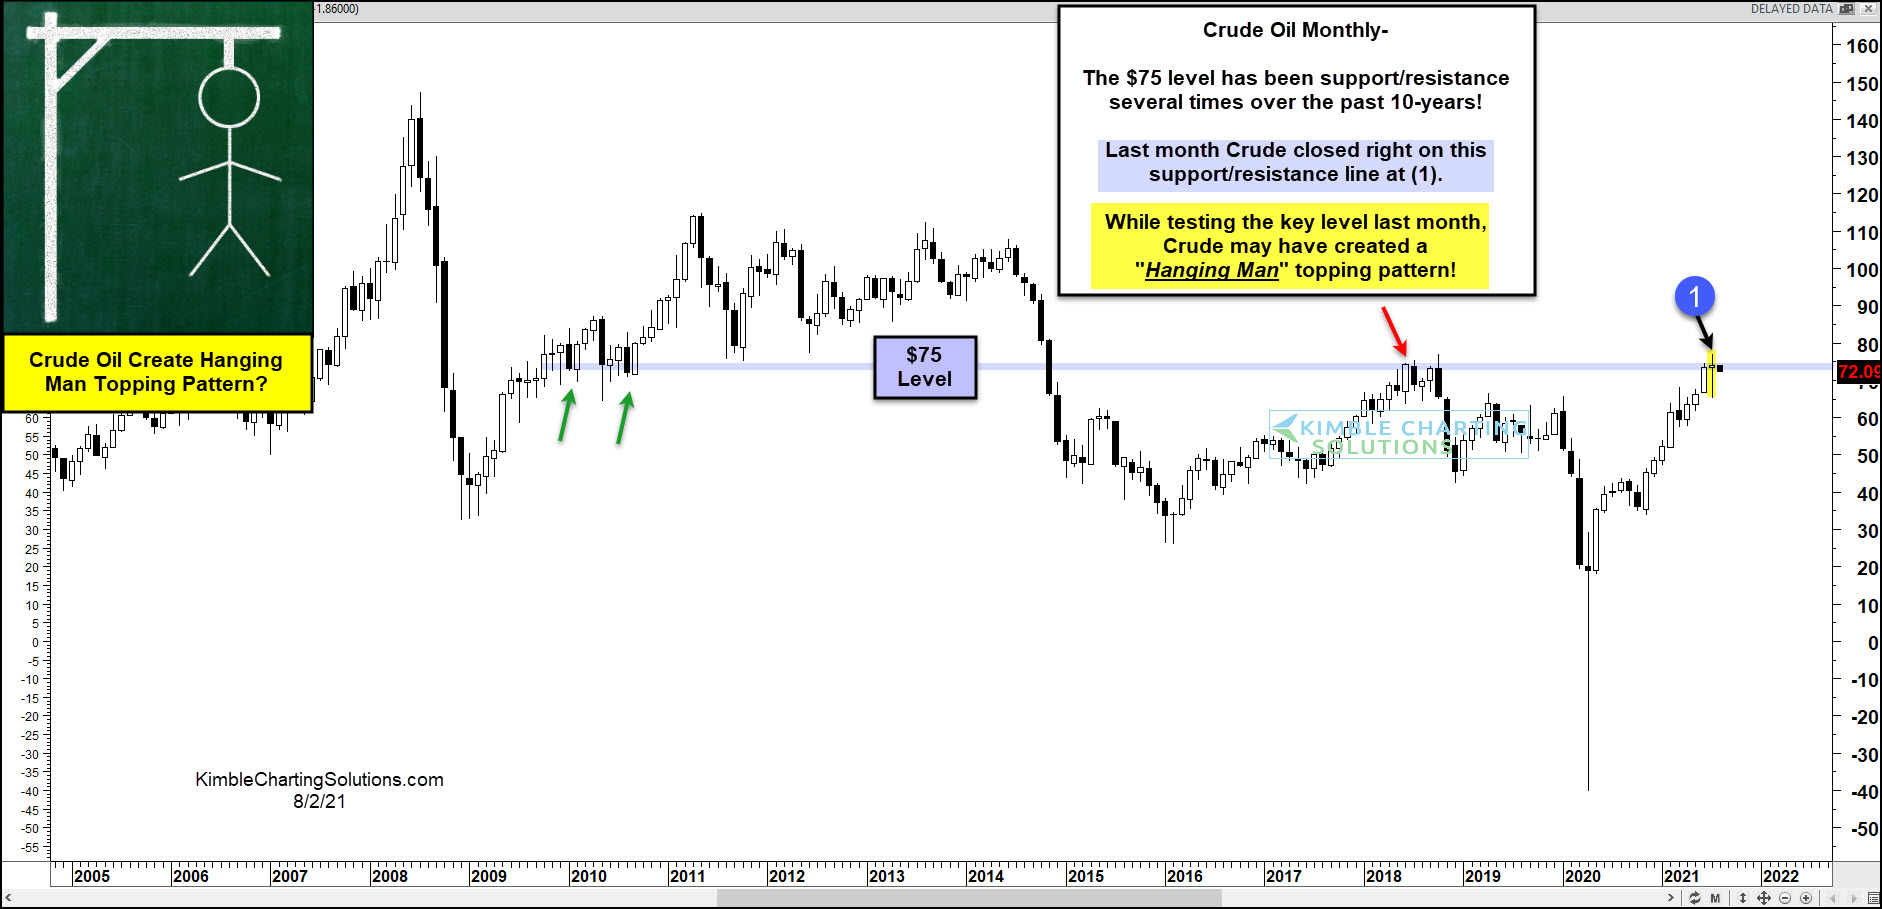
Today we look at a long-term “monthly” chart of Crude Oil futures… and why we may be at a key inflection point.
The $75 level has been support and resistance multiple times over the past 10 years. And last month, Crude Oil closed right on this key support/resistance line at (1).
But the price action also did something that could have bearish implications.
While testing this key level last month, Crude oil may have created a “hanging man” topping pattern. Any further decline this month would raise concerns of a bearish reversal pattern taking hold.
(Click on image to enlarge)


Comments
Log in or sign up to join the conversation.