
Summary
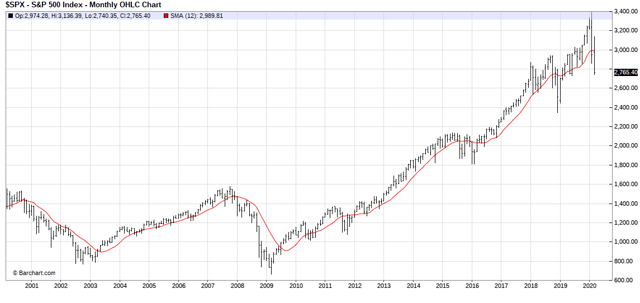
- 25.28% gain in the last 3 years.
- 44.75% gain in the last 5 years.
- 128.32% gain in the last 20 years.
I have chosen the S&P 500 Index (SPX) as the Barchart Chart of the Day. The chart below is a monthly chart of the S&P 500 Index plotted against its 12-month moving average over the past 20 years. As you can see the market moves in broad trends and if you bought in during the major market upticks and been sitting on the sidelines during the market contractions you would have done alright.
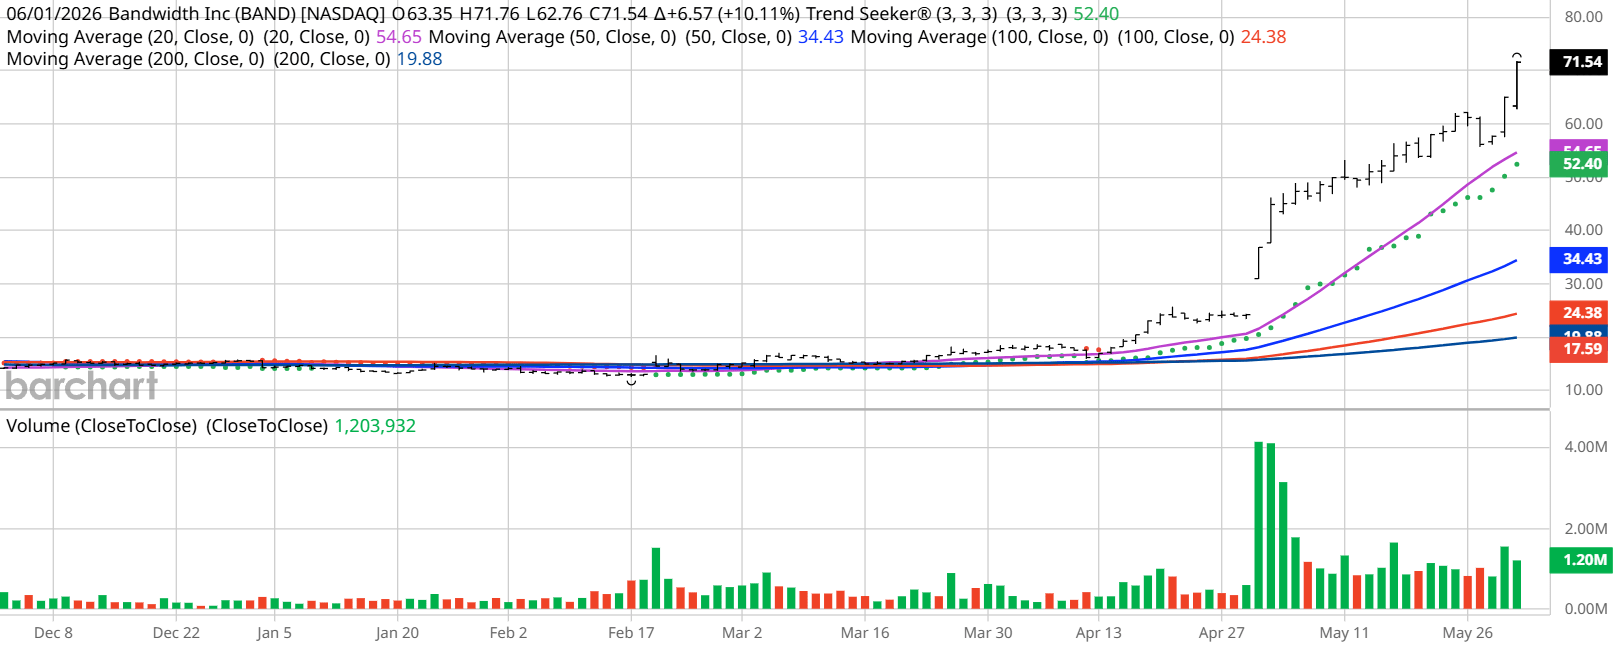
Do not panic, have rational stop losses in place. My personal stop losses are the 200 Day Moving Averages on Major Index ETFs and the 100 Day Moving Averages on individual stocks.I refer to stop loses as your own personal tolerance for pain. How much can you afford to lose without having chest pains?
(Click on image to enlarge)
Barchart's Opinion Trading systems are listed below. Please note that the Barchart Opinion indicators are updated live during the session every 10 minutes and can therefore change during the day as the market fluctuates. The indicator numbers shown below therefore may not match what you see live on the website when you read this report.


Comments
Log in or sign up to join the conversation.