

(Click on image to enlarge)
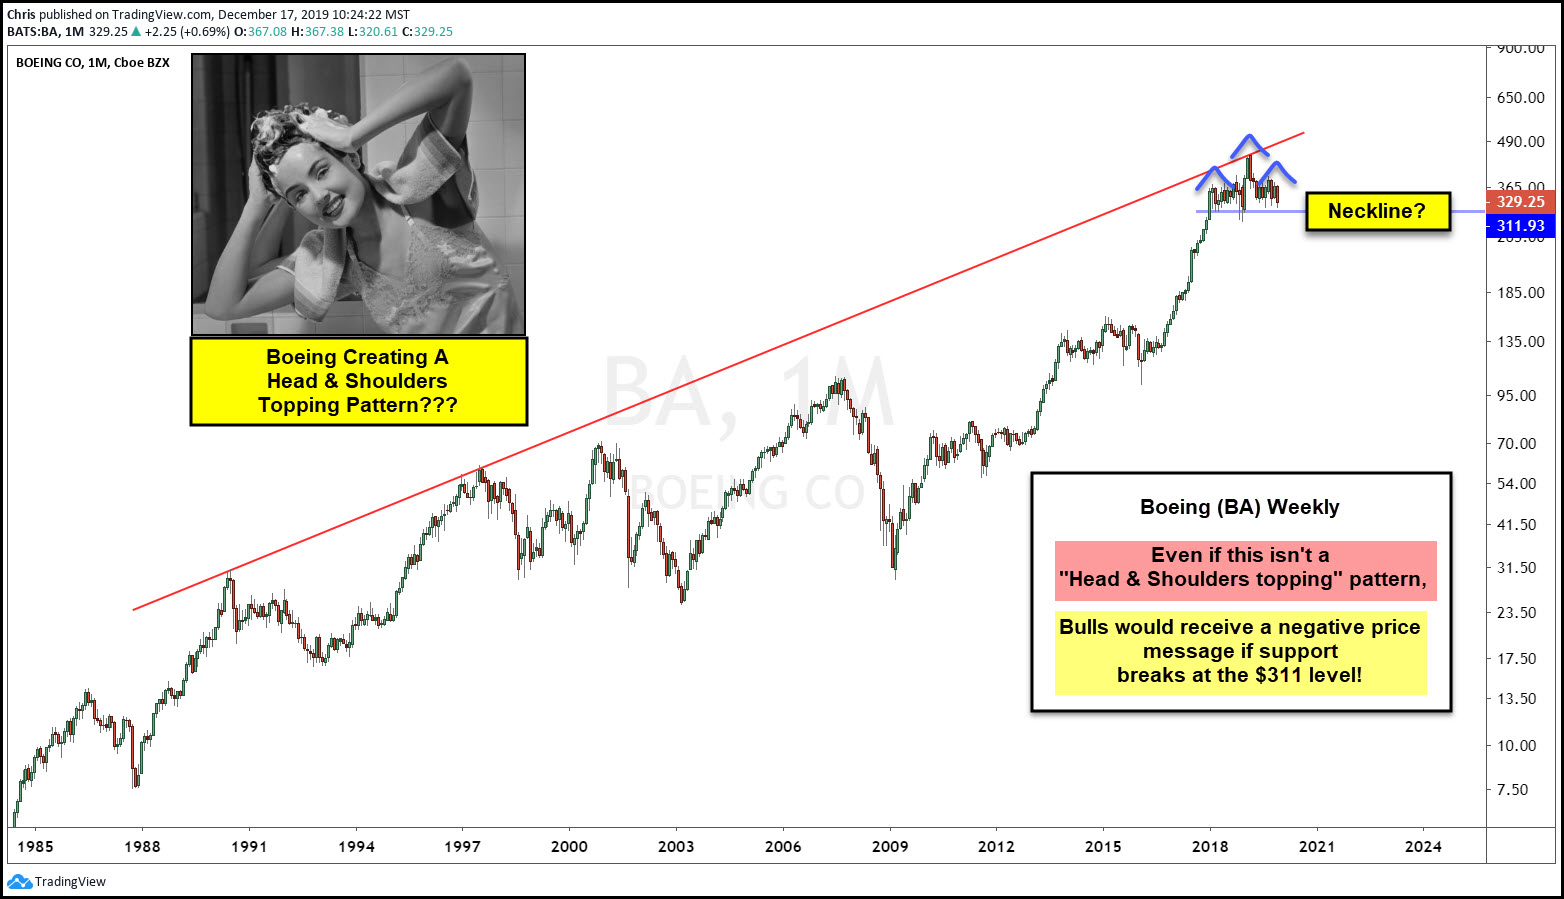
Boeing (BA) seems to be in the news a ton of late. But perhaps an even more important bit of news for investors has to do with the long-term chart of Boeing’s stock (BA).
And how this chart pattern plays out will have ramifications for $BA investors, as well as the broader market (as Boeing is a large-cap in the Dow Jones Industrials Average).
Is $BA Creating A “Head and Shoulders” Topping Pattern?
As you can see in the chart above, a potential “head and shoulders” topping pattern is in play on the “weekly” chart for Boeing (BA). And even if this is considered to be a sloppy head and shoulders pattern, the formation has the look of a potential rounded top as well. This will go from a minor concern to major concern should Boeing break down through neckline support.
With this in mind, investors should watch the $311 price support, as support is support until broken. Bulls do not want to lose that level. Stay tuned!



Comments
Log in or sign up to join the conversation.