

It's one week till the US presidential election and traders around the globe are not only excited who will win the race: incumbent President Donald Trump or former US vice president Joe Biden.
In fact, traders are wondering what impact the US election might have on the US economy and the financial markets in general – so let's have a look…
Is a re-election of Trump more bullish than a Biden-victory for US Equities?
Usually a re-election is more positive for Equities and the SP500, but…
When looking back to 1950, the re-election of a US president usually went hand in hand with a strong US economy, which is currently not the case, post-Corona lockdown.
But when ignoring this aspect, a strong economy is also often the driver higher for US Equities, meaning that the re-election of a president is usually positive for US equities – and numbers prove that.
Going back to 1950 and looking at the SP500 performance if the incumbent was re-elected, 12 months after election the SP500 traded on average 9.6% higher – compared to 4.8% with a new president in office.
What is certainly interesting here is that a re-election of the US president resulted in a positive equity performance over the next 12 months in over 70% of the cases (5 out of 7). The negative performances under Eisenhower (-14.3% / 1956/1957) and Nixon (-17.4% / 1972/1973) were the only two occasions that were followed by two recessions and were probably anticipated in US equities.
This means, on the other hand: if this time is no different, a drop in US equities could be even sharper if US president Trump is re-elected.
If Joe Biden, on the other hand, is elected, the picture, in terms of US Equities, is quite favorable, but still mixed. Therefore, we just want to look at the last two presidents who took office during a recession or shortly before:
- President Obama: he took over during a recession and during his first term, the SP500 traded 23.5% higher after his first 12 months in office
- Bush Jr: amid the resulting recession of the Dot-com-bubble burst, the SP500 traded 13% lower in November 2001, after his first 12 months in office.
To make a long story short: when looking at pure statistics back to the 1950s, the re-election of an incumbent is usually positive for US Equities.
However, too much optimism should be avoided due to the recent Coronavirus developments and the fact that we find ourselves in a recessive environment, globally, which is not usually a very positive sign if the incumbent is re-elected.
So, how can you trade the S&P500 in this difficult environment?
The overall picture in the SP500 CFD remains bullish as long as we trade above the SMA(200), some technical traders might even argue that we continue to be bullish as long as we are above 2,950/3,000 points.
But what makes the longer-term worrisome is that such a test of the region around 3,000 points would obviously correspond to a breach of the SMA(200), pointing to a trend reversal, corresponding to a dark outlook for US Equities in the upcoming 12 months.
But, as long as the SP500 CFD trades above its SMA(200) and above 2,950/3,000 points, price action clearly favours long engagements and a run up to 3,800. Even 4,000 points remains an option:
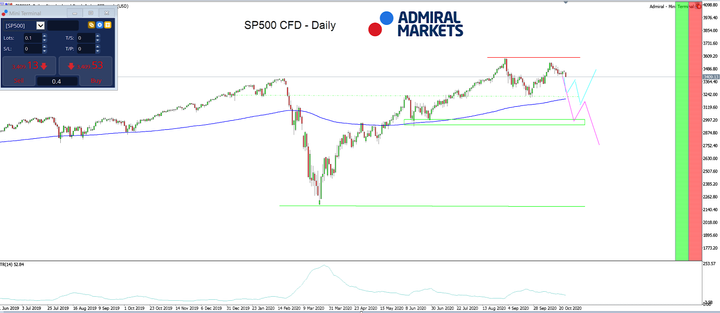
Source: Admiral Markets MT5 with MT5SE Add-on SP500 CFD Daily chart (between June 11, 2019, to October 26, 2020). Accessed: October 26, 2020, at 3:00 PM GMT. Please note: Past performance is not a reliable indicator of future results, or future performance.
In 2015, the SP500 CFD fell by -0.73%, in 2016, it increased by 9.54%, in 2017, it increased by 19.42%, in 2018, it fell by -6.24%, and in 2019, it increased by 28.88%, meaning that in five years, it was up by 56.9%.



Comments
Log in or sign up to join the conversation.