

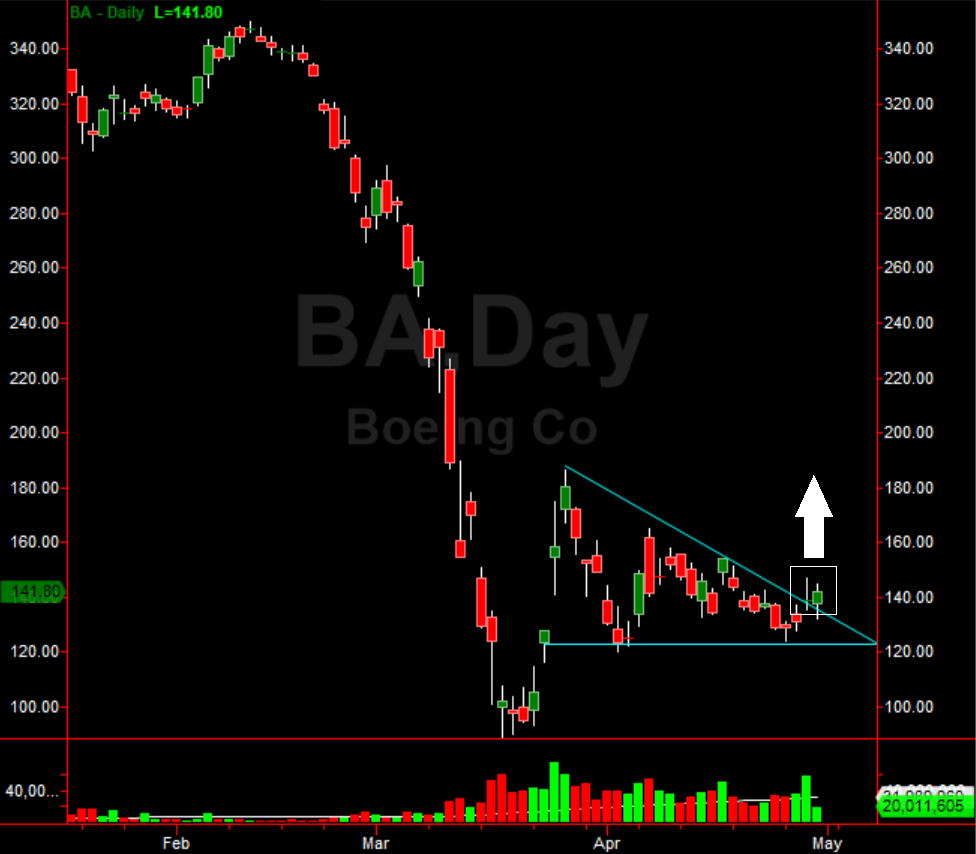
Stock chart technical trading is the best method for consistently buying lows and selling highs. Using things like gap fills, head and shoulder patterns, bull and bear flags has made millions into millionaires. On that note, there is a technical investor stock chart breakout on Boeing Co (BA). The stock has consolidated for a month, forming a bull flag. If you connect the highs of the flag pattern, price finally closed above that trend line yesterday (note chart below). This triggers a potential breakout on Boeing with upside to at least $180.00. The current price resides near $141.00.
This technical investor stock chart breakout is a sweet pattern setup for swing traders. Who knows where Boeing will be in a year or two, but the short-term signal is flashing buy. On a strictly technical basis, a stop would be placed on any daily close below $121.00 (the flat trend line connecting the lows of the bull flag). Please note, this investor stock chart breakout alert is for swing traders, not long-term investors. I plan to hold mine until $180.00 then exit.
(Click on image to enlarge)



Comments
Log in or sign up to join the conversation.