

...Intelligent investors...understand that the long-term is the only time horizon that matters [and] one of the best ways to plan for the long-term is by setting reasonable expectations. What’s considered reasonable based on where we stand today? Hint: Lower your expectations for future stock market returns in the U.S., expect higher returns in foreign equities and brush up on your bond math.
Written by Ben Carlson (awealthofcommonsense.com)
There is no easy way to predict stock market returns, but valuations are as good a starting point as any. Historically, the lower the starting cyclically adjusted price-to-earnings ratio, the higher the future returns have been on average, and vice versa.
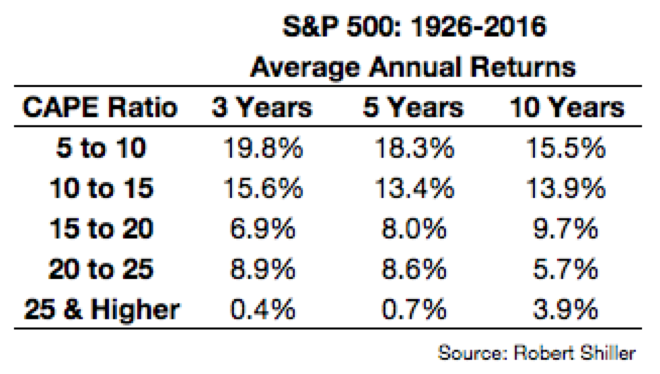
The CAPE ratio is by no means foolproof. It’s always good to look at a wider range of valuations to get a better sense of the current landscape to determine the markets that are more or less attractive around the globe. By those measures the rest of the world is trading at a discount of anywhere from 22% to more than 100% in terms of relative valuations in comparison to the U.S.
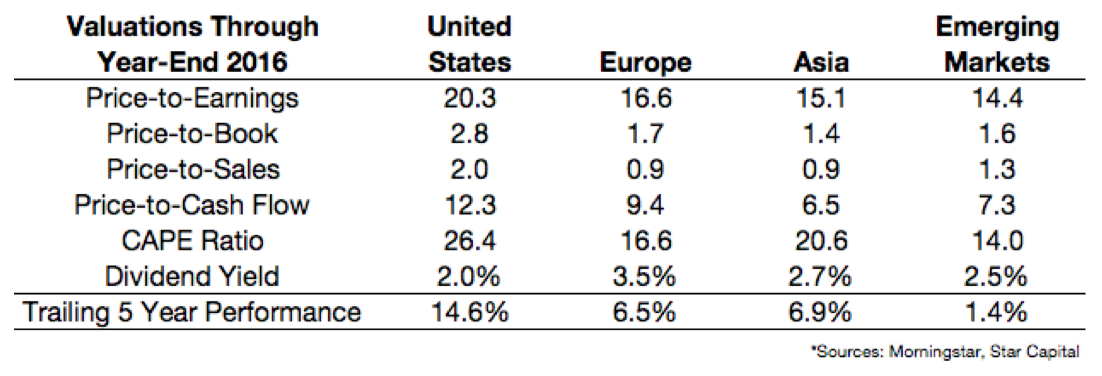
The U.S. is the most expensive market across every valuation metric, but that makes sense given the huge outperformance over the past five years. Taking the CAPE yield — the inverse of the CAPE ratio — would give us expected returns of 3.8 percent, 6.0 percent, 4.9 percent and 7.1 percent, going from left to right.
A crude formula for expected stock market performance, long championed by Vanguard Group Inc.’s founder, John Bogle, is:
- dividend yield
- plus corporate earnings growth
- plus or minus the change in price-to-earnings ratio.
The first part of the equation is simple and the second part can be approximated but the third part is a little tricky to pin down. Changes in valuations are driven by allocation preferences and investor sentiment. This is another way of saying that valuations depend on human emotions, which are almost impossible to predict.
Valuations can tell you how cheap certain markets are, but they can’t tell you when other investors will recognize bargain prices. Valuations and starting yields aren’t perfect forecasters, but they do make it clear when stocks in Europe, Asia and emerging markets should have higher expected returns than U.S. equities from current levels.
Unlike stock market performance, bond returns are more or less governed by math. If you would like to approximate your long-term returns, the best place to look is the current yield.
The following chart shows the starting yield for the benchmark 10-year U.S. Treasury note going back to 1928 plotted against the subsequent 10-year annual returns.
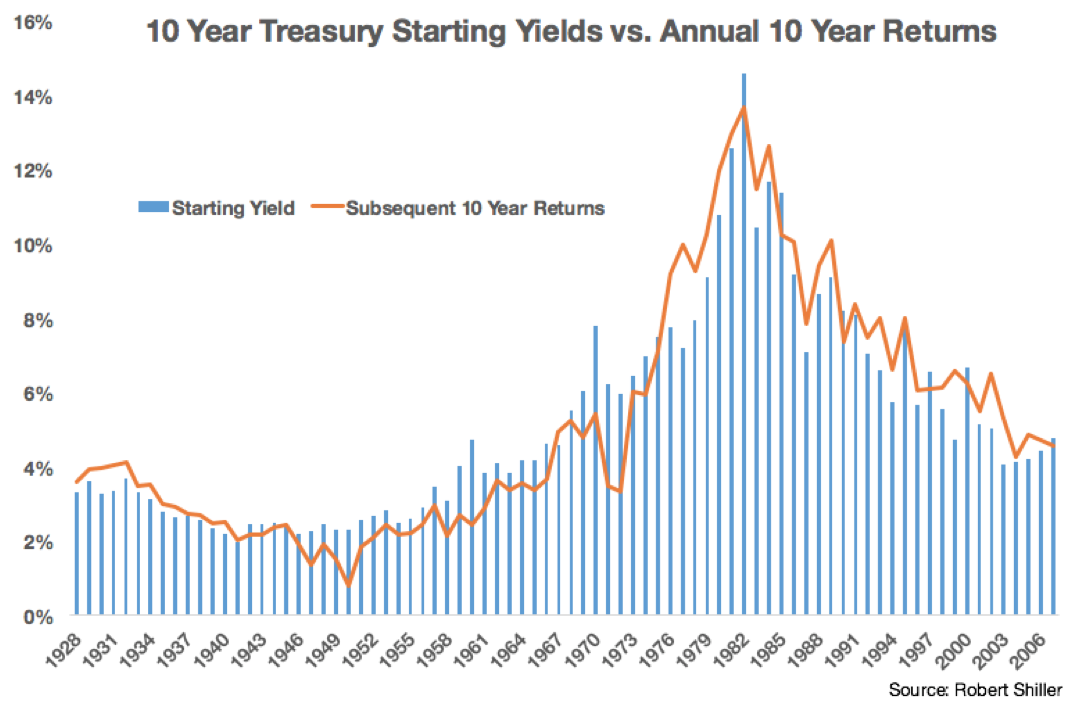
- The correlation between starting yield and subsequent returns is 0.95, showing a strong positive statistical relationship. It would seem obvious that returns would come close to starting yields since the 10-year time frame matches the maturity of the bond, but this relationship seems to hold over various maturities and other time frames.
- The correlation between starting 10-year yields and subsequent 5-year returns is 0.87. Things look similar for longer maturity Treasuries. The starting long-term yield has a correlation with five- and 10-year returns of 0.96 and 0.88.
- Those returns are for high-quality bonds, so expectations need to be adjusted for lower-rated securities. Long-term returns for high-yield, or junk, bonds have been about 3.5 percentage points less on average than the starting yield over the past 30 years.
- Although expectations also need to be adjusted for credit risk and inflation, it’s clear that starting yields do a much better job of predicting long-term than short-term performance.
- Also, expect an uptick in volatility in bonds because the yields are much lower than they have been historically, meaning the same change in interest rates will have a greater effect now on bond prices than they would have at higher rates in the past.


.webp)
Comments
Log in or sign up to join the conversation.