

The oil industry isn’t going away any time soon, even if the world continues to move towards clean energy. The United States has never been as energy self-sufficient as it is today, thanks to domestic oil and natural gas production. And that trend that does not seem to have an end in sight—with bidding wars over the Permian Basin and high-flying acquisition prices for oil companies making news in the sector.
To traders playing the energy sector, there are many different business segments that may create market gyrations, and moments of opportunity, whether the news is about OPEC negotiations or solar powered cars. And it doesn’t matter whether you’re bullish or bearish.
The oil and gas industry can be divided into three segments, frequently referred to as upstream, midstream, downstream.
- Upstream is the process of exploration and production of crude oil. This includes the drilling of wells, research into new sites with potential as oil fields, and all other aspects of the production process for crude oil.
- Midstream is the process involved in the transportation, storage, and wholesale distribution of crude petroleum products. The transportation of crude oil from oil fields to its final destination is accomplished through a collection of pipelines, barges, trucks and trains.
- Downstream is the process that primarily deals with the refining of oil, as well as the supply and trading of retail petroleum products to consumers.
Energy Sector Index landscape: know before you trade
The Select Sector Energy Index and the Dow Jones U.S. Oil & Gas Index are typically known as the energy benchmark indices. However, due to its marketcap weighting approach, two companies, Exxon and Chevron, make up 43% of those indices! They may seem diverse because they have 30 or more names in each index, but you’re really making a large bet on those two names and then lesser allocations to many smaller players in the energy industry.
The Solactive MicroSectors U.S. Big Oil Index was introduced in 2019 as an alternative to the Select Sector Energy Index and the Dow Jones U.S. Oil & Gas Index. This equal weighted index is comprised of the 10 largest energy companies in the United States. Exxon and Chevron make up only 20% (10% each) of the MicroSectors U.S. Big Oil Index.
When excluding both Exxon Mobil and Chevron both benchmark indices, the average weighted market capitalization drops from roughly $140 billion each to roughly $37 billion for the Select Sector Energy Index and $33 billion for the Dow Jones U.S. Oil & Gas Index. The MicroSectors U.S. Big Oil is at roughly $90 billion in comparison, which may be a better representation if you are looking to trade just the leaders in energy.
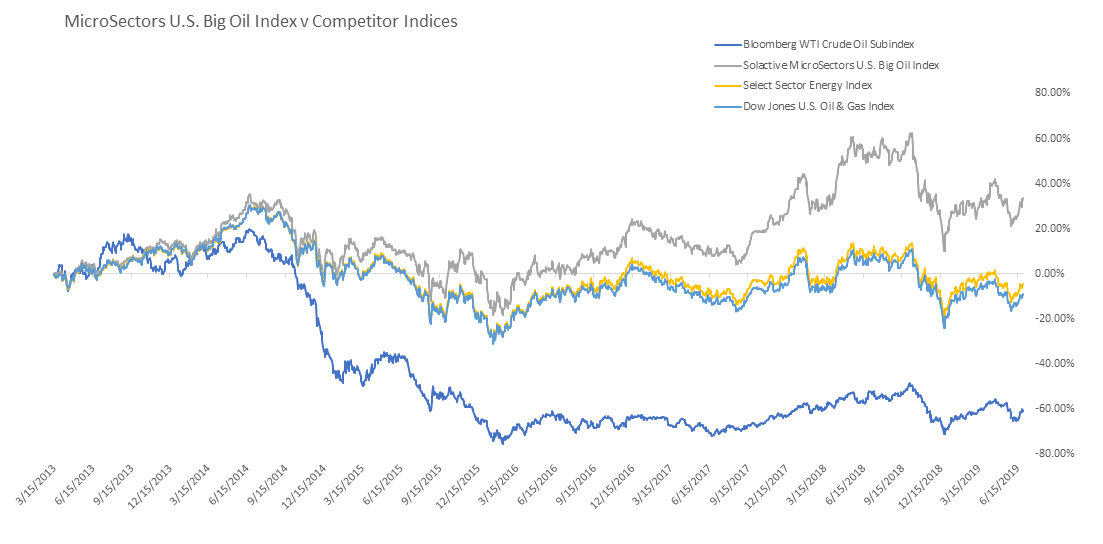
Source: Bloomberg, index data as of 6/30/2019. The Solactive MicroSectors U.S. Big Oil outperforms its competitor benchmarks since inception.
Max Drawdown Analysis During Oil Sell-off
During the crude sell off during late 2015 and early 2016, the MicroSectors U.S. Big Oil index had the least amount of drawdown relative to these benchmark indices. OPEC could not come to an agreement for its members on oil production which when combined with the surging U.S. output it resulted in an oversupply and downward pressure on crude prices. The price of a barrel of oil was cut by over 50% in less than a year, but by having just the biggest 10 oil companies the MicroSectors U.S. Big Oil was better positioned to handle this downturn, unlike the other benchmark indices that declined more during this sell off.
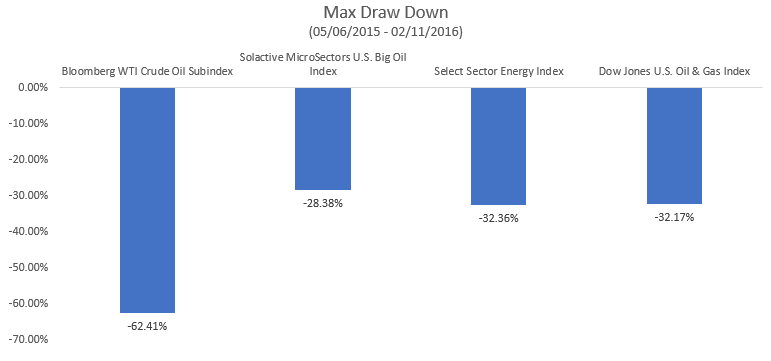
Source: Bloomberg
The Solactive MicroSectors U.S. Big Oil Index fills a gap in the marketplace for sector-specific trading products that deliver precisely targeted exposure. Reference our website for information how to access this index with available products.
What is the Solactive MicroSectors U.S. Big Oil Index?
The Solactive MicroSectors U.S. Big Oil Index includes 10 highly liquid stocks that represent industry leaders across today’s U.S. oil/energy sector. The index’s underlying composition is equally weighted across all stocks, providing a unique performance benchmark that allows for a value-driven approach to investing.
Why did we launch the Big Oil Index?
We created MicroSectors indices to provide investors and traders a new benchmark for the most closely watched and biggest names in a given sector, in this care the energy/oil sector. Other energy indices are top heavy, and we feel that there are advantages to having a more equally weighted distribution amongst all the top players and not just one or two. The MicroSectors Big Oil index comprises the biggest and best of breed American oil producing companies.
Solactive MicroSectors U.S. Big Oil Index Holdings:
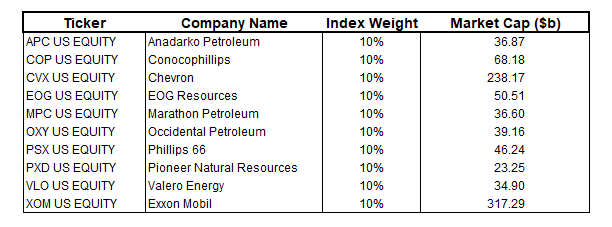
Source: Bloomberg, market cap & weighting data as of 7/19/2019. Index rebalances monthly to equal weight.
Laser focus on the names that lead the sector
Energy stock prices can be driven by numerous factors such as: OPEC decisions of supply, demand for oil, geopolitics, domestic legislation and advancements in clean energy alternatives.
One may face uncertainty when trying to pick which oil companies may survive or perform the best given the outside factors or even the company specific factors when it comes to one off events like oil spills. But if you do want to participate in this trade, it’s the biggest, most highly traded names in the energy/oil sector that may give you the play you’re looking for.
The Solactive MicroSectors U.S. Big Oil Index features just the names you know, in the sector you’re following. We focus on these stocks because they are some of the most traded and followed names in U.S. equity markets. Many would even consider these the leaders in their sector.
While the 10-stock basket in the Solactive MicroSectors U.S. Big Oil Index constitutes 68% of the Select Energy Index, by weight, they also make up 57% of the social media velocity for that entire index!
Social Media Velocity Comparison: MicroSectors U.S. Big Oil Index vs the Select Energy Index
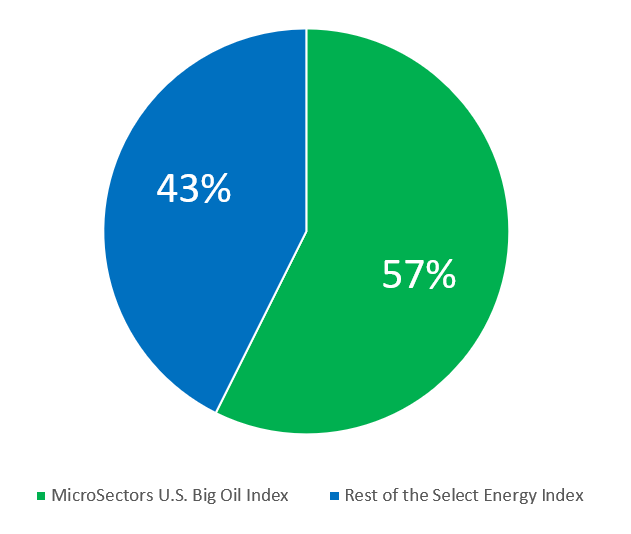
Index constituents per Bloomberg 07/18/19. REX Social Velocity score based on number of followers for each constituent across news and social media channels such as Stocktwits.
Bottom Line:
MicroSectors Big Oil is not top heavy like other indices. It does not have allocations to smaller energy players. It gives a full representation of the oil distribution ecosystem represented through the largest 10 players in the industry, without too much focus on one or two names. With the proposed merger between Anadarko and Occidental Petroleum, will there be more M&A activity in the space? Will oil prices continue to fluctuate? How will the current state of the geopolitical sphere effect how these companies move forward?
Whether you have strong bullish or bearish view on the oil sector, we believe this index may be for you!



Comments
Log in or sign up to join the conversation.