


GBPUSD hits another low
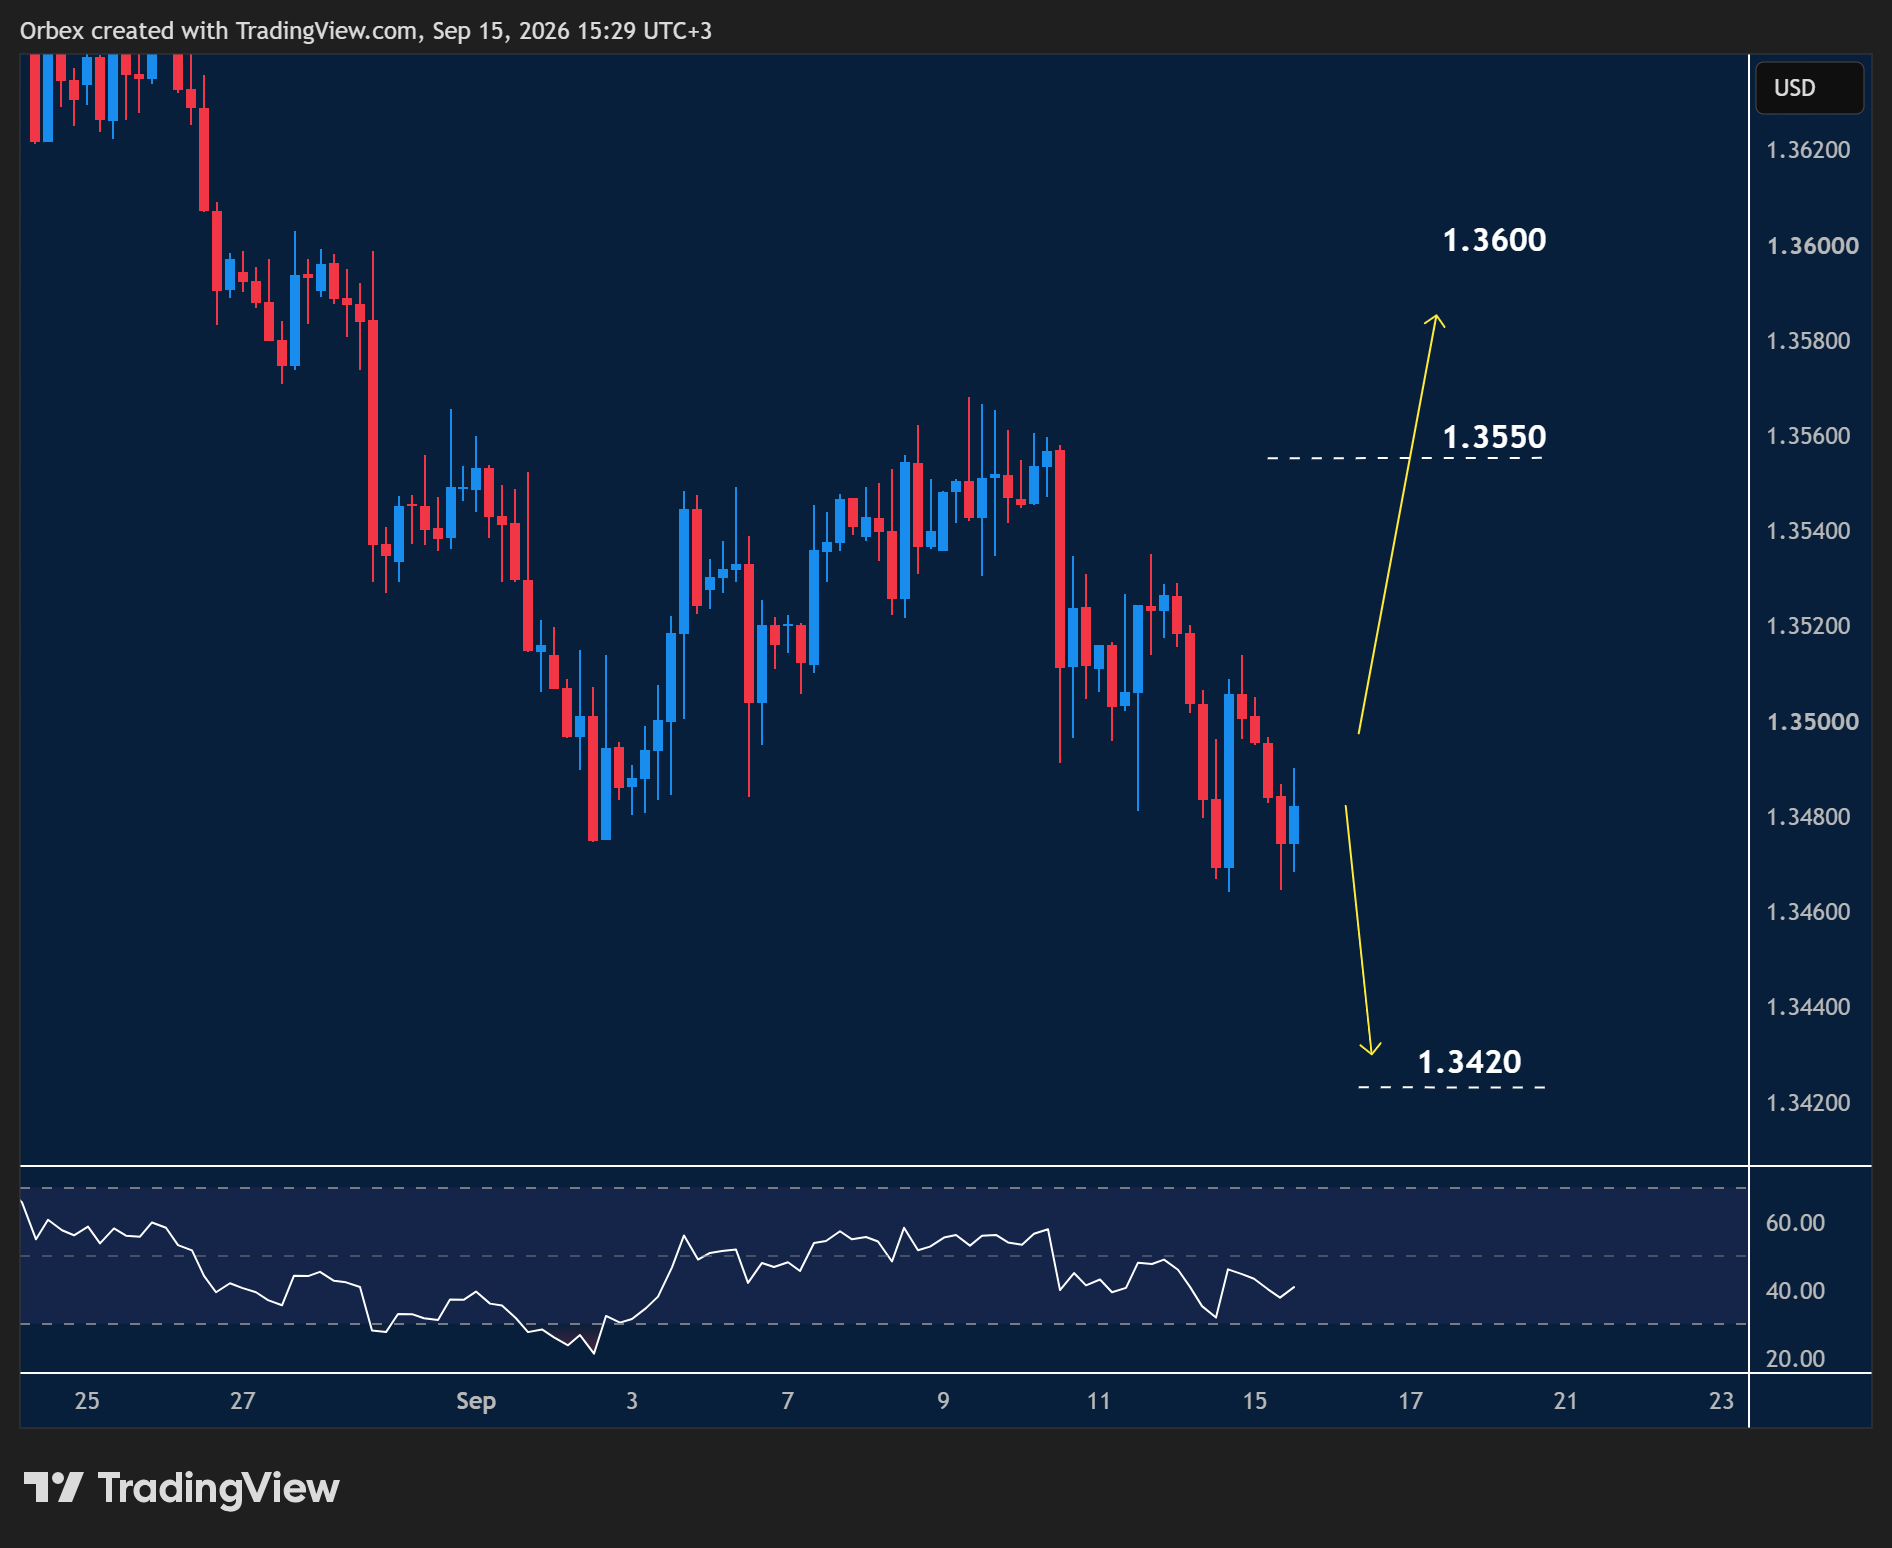
Cable’s bearish run continued as sticky unemployment data added more pressure to the pair.
Prices have been pushing lower after breaking below the dynamic support of 1.3500.
The swing low of 1.3420 is a critical level to maintain, as its breach could open the door to a deeper sell-off.
A continuous oversold RSI suggests a slowdown is imminent, but selling interest could continue.
A break above 1.3550 could confirm a test towards 1.3600.
USDCHF probes resistance
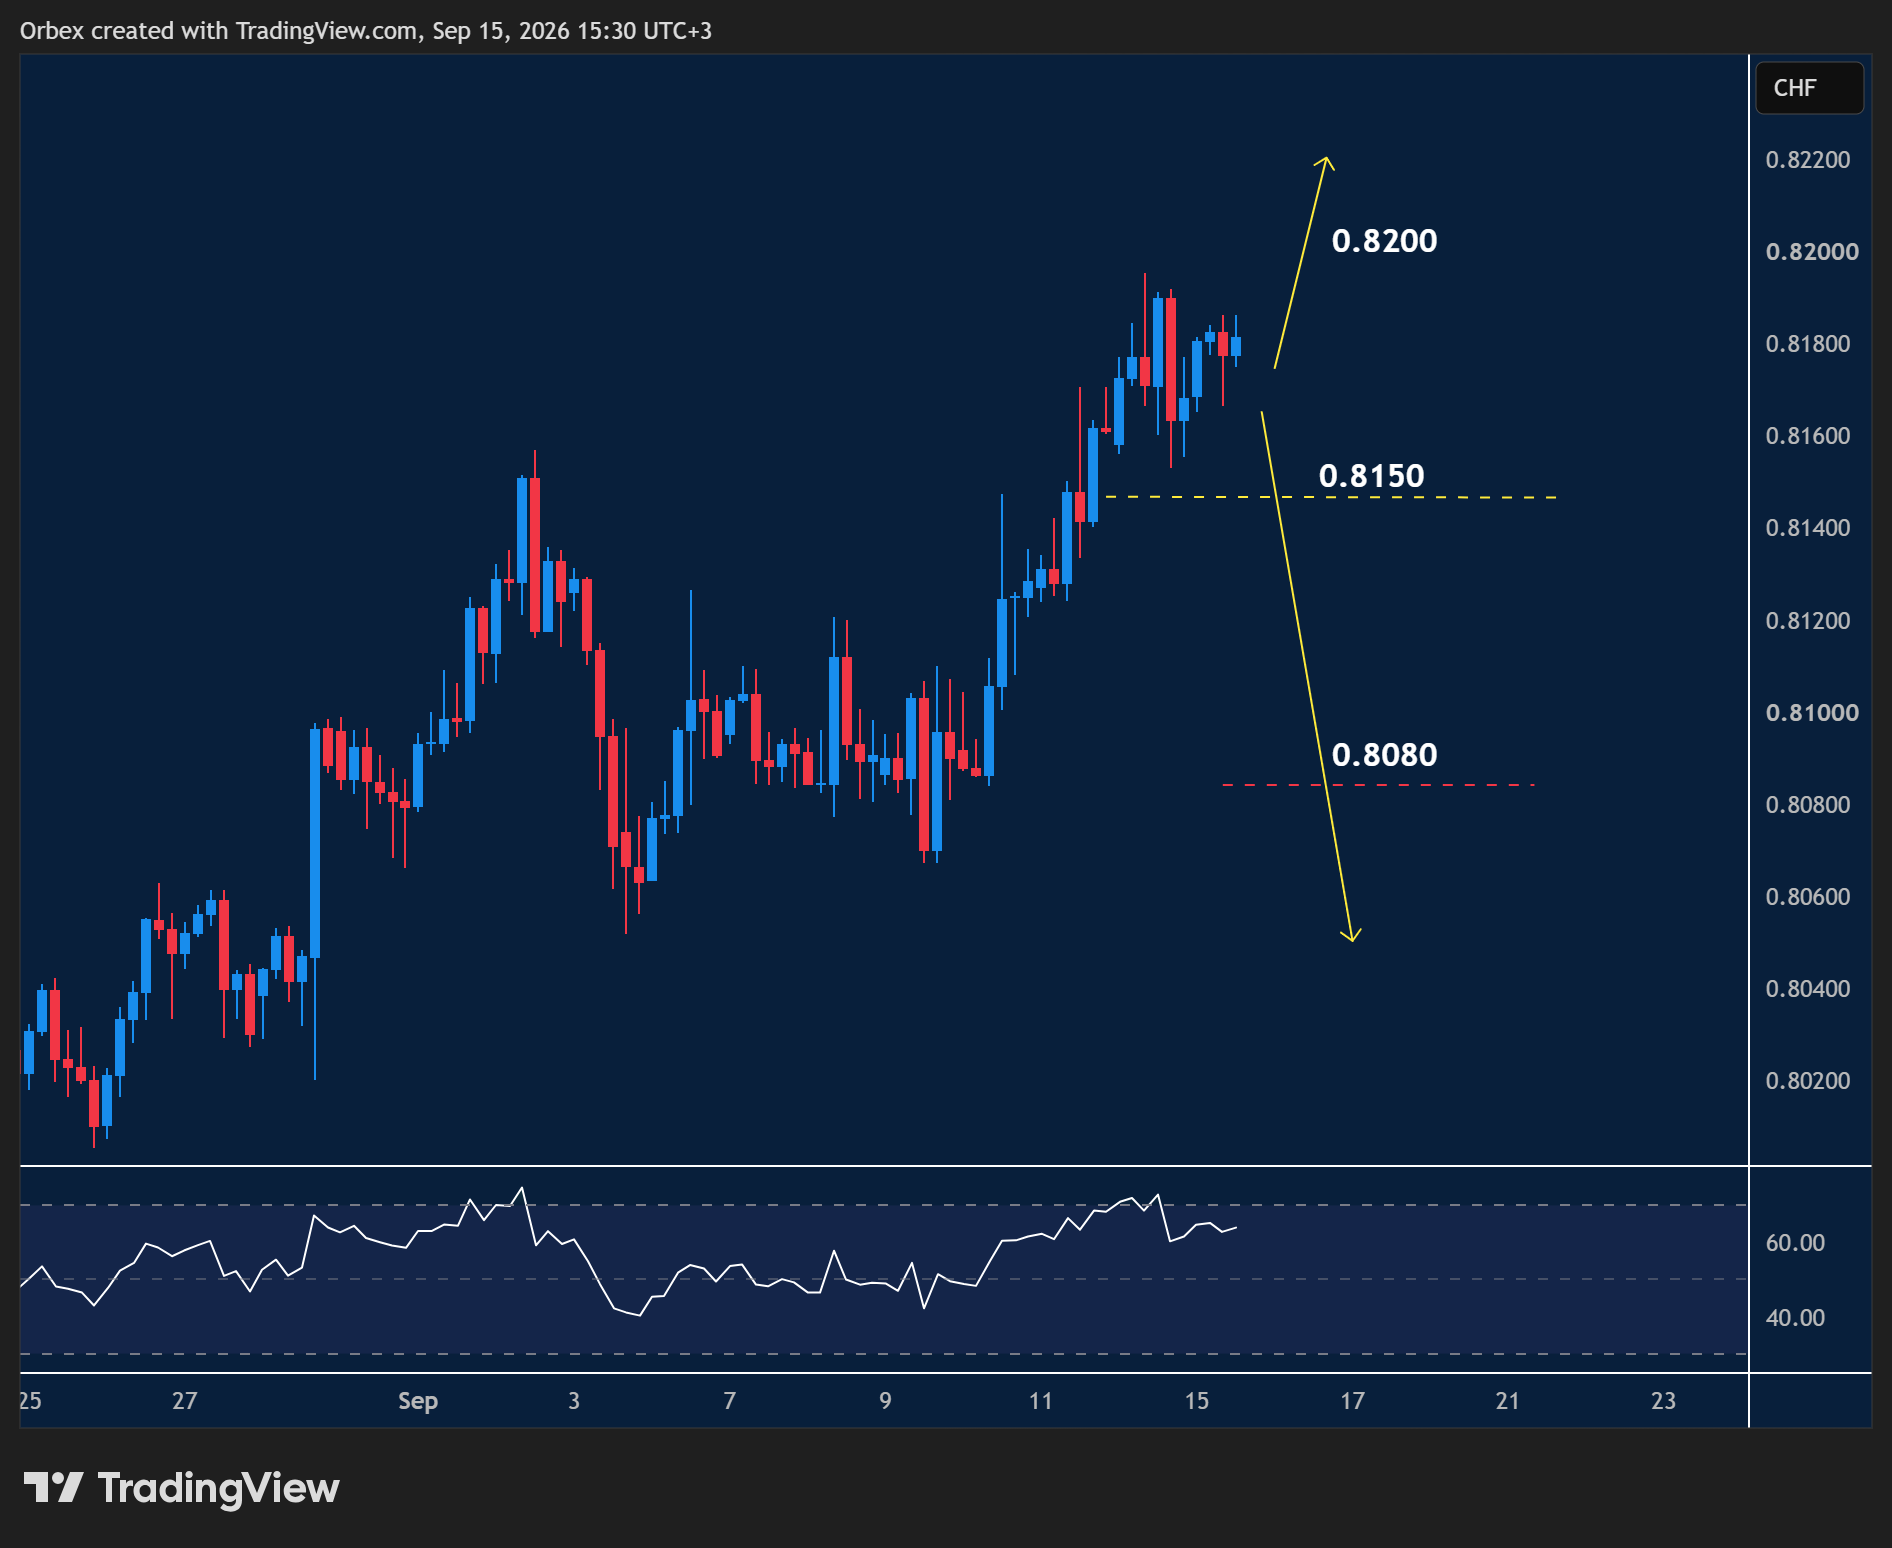
The US dollar rises as traders prepare for a rate hike in today’s Fed meeting.
Another bounce to the recent top towards 0.8200 suggests the dollar’s drive could continue.
The bullish rally gives an opportunity for dollar traders to probe for resistance.
A turnaround first needs a break at 0.8150, which would force early sellers to jump on board.
The pair could then test the previous base at the 0.8080 region.
SPX 500 sliding lower
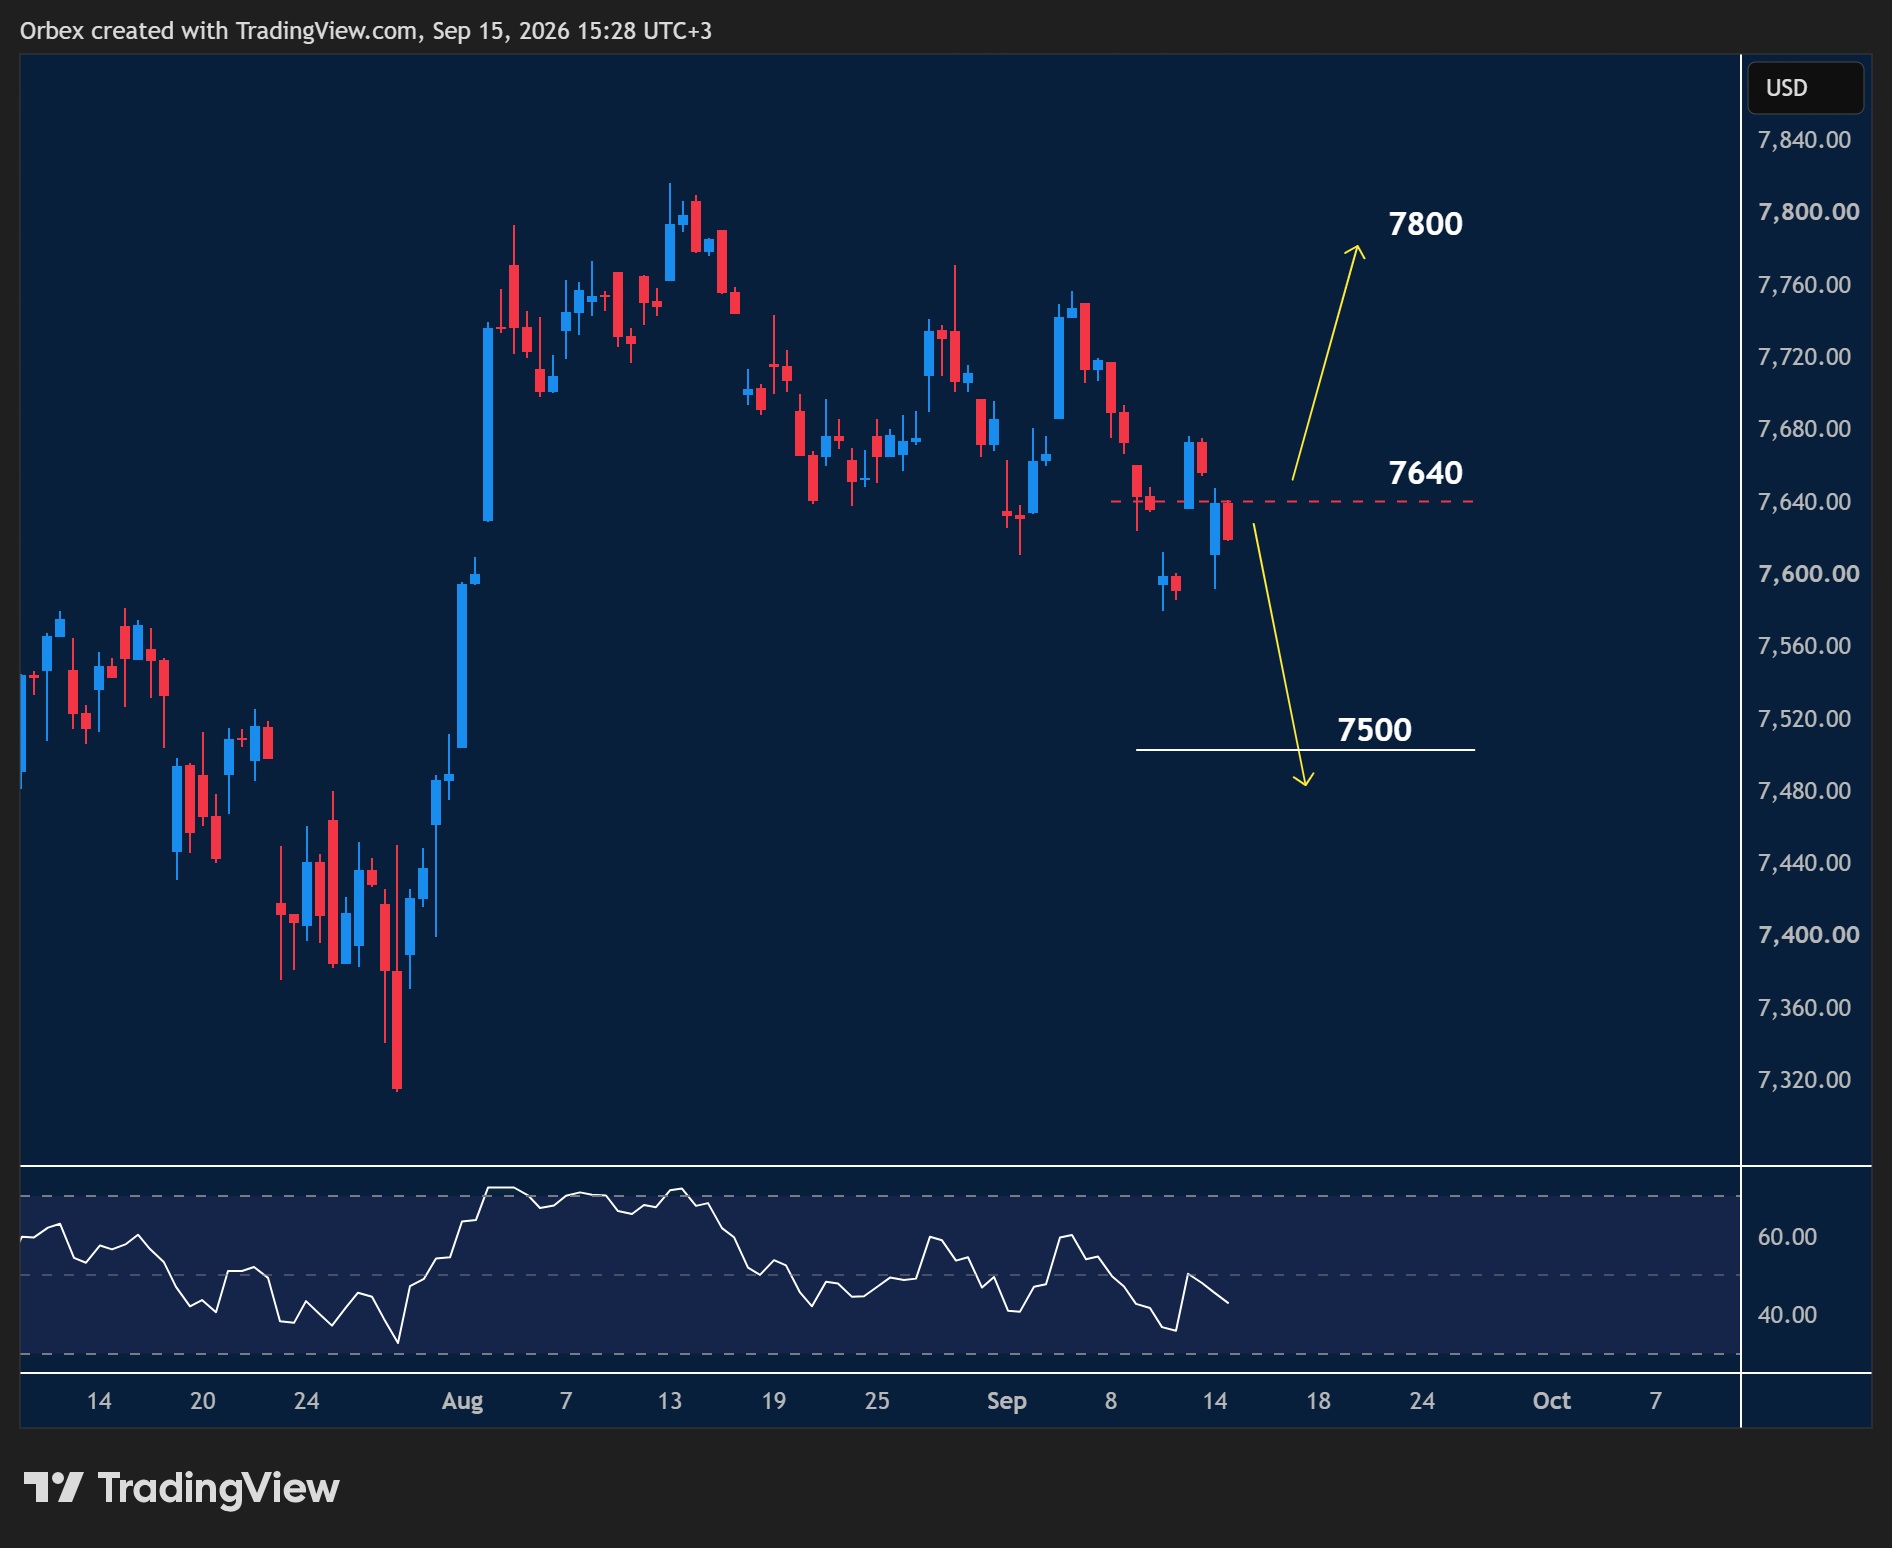
The S&P (SPX 500) confirmed its bearish stance after failing to make a dent in the higher prices.
7640 is the hurdle to break and a key level to see if bulls progress as the RSI pushes into neutral territory.
Any sign of a continuation lower would first see a test at 7500.
7800 is a firm top if the Federal Reserve pushes indices to new records


Comments
Log in or sign up to join the conversation.