


UK 100 probes support
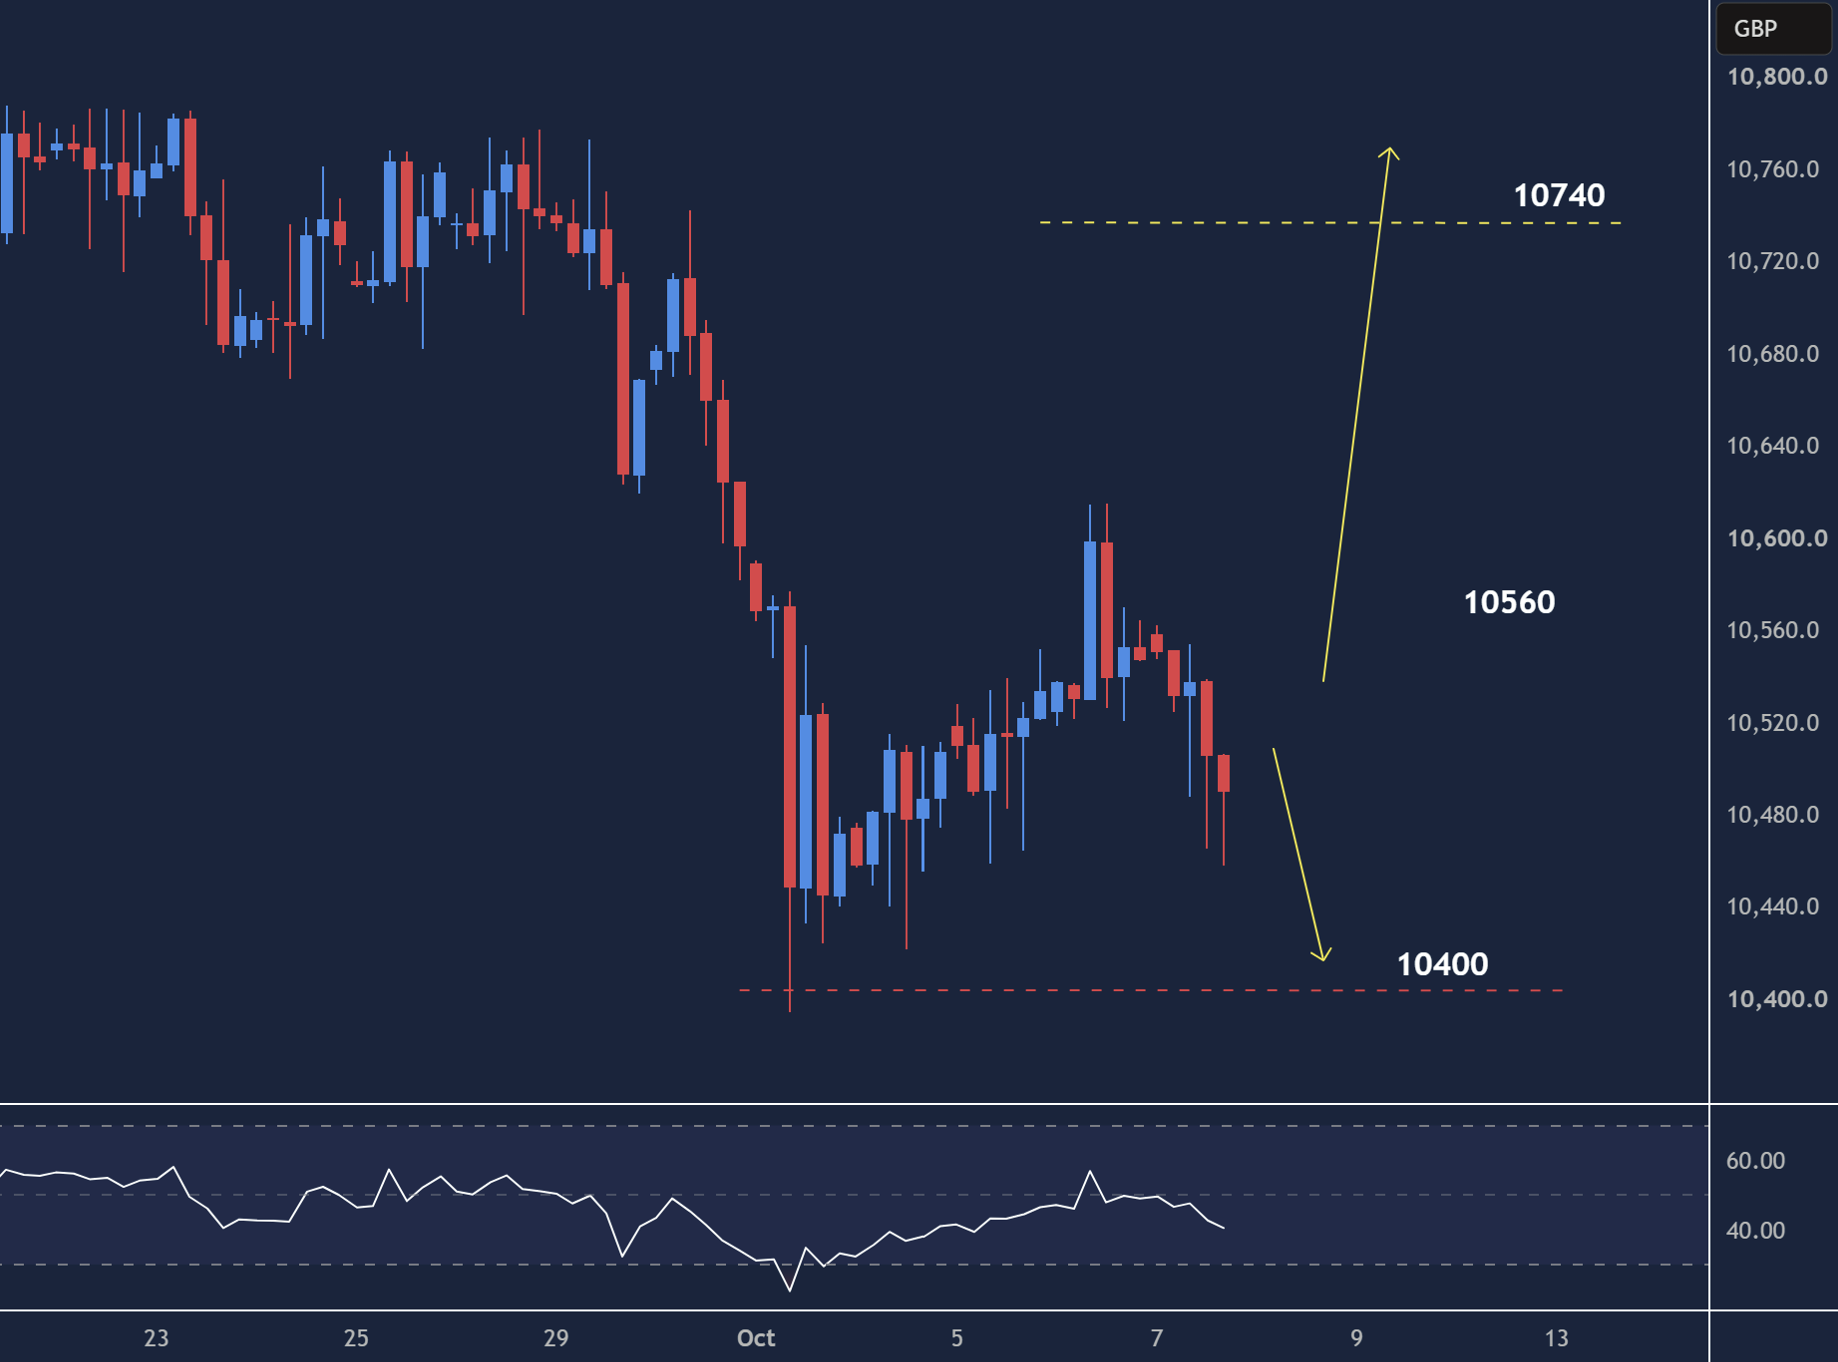
The FTSE (UK 100) continues to fall as the worry over higher energy prices weighs heavily on investors.
The latest downturn looks for support as profit-taking and bargain hunting send the index lower.
10400 is the next test lower, and a bearish breakout could extend the rally.
However, a jump above 10560 could cause a reversal towards 10740 at the previous swing high.
USDCAD tests major resistance
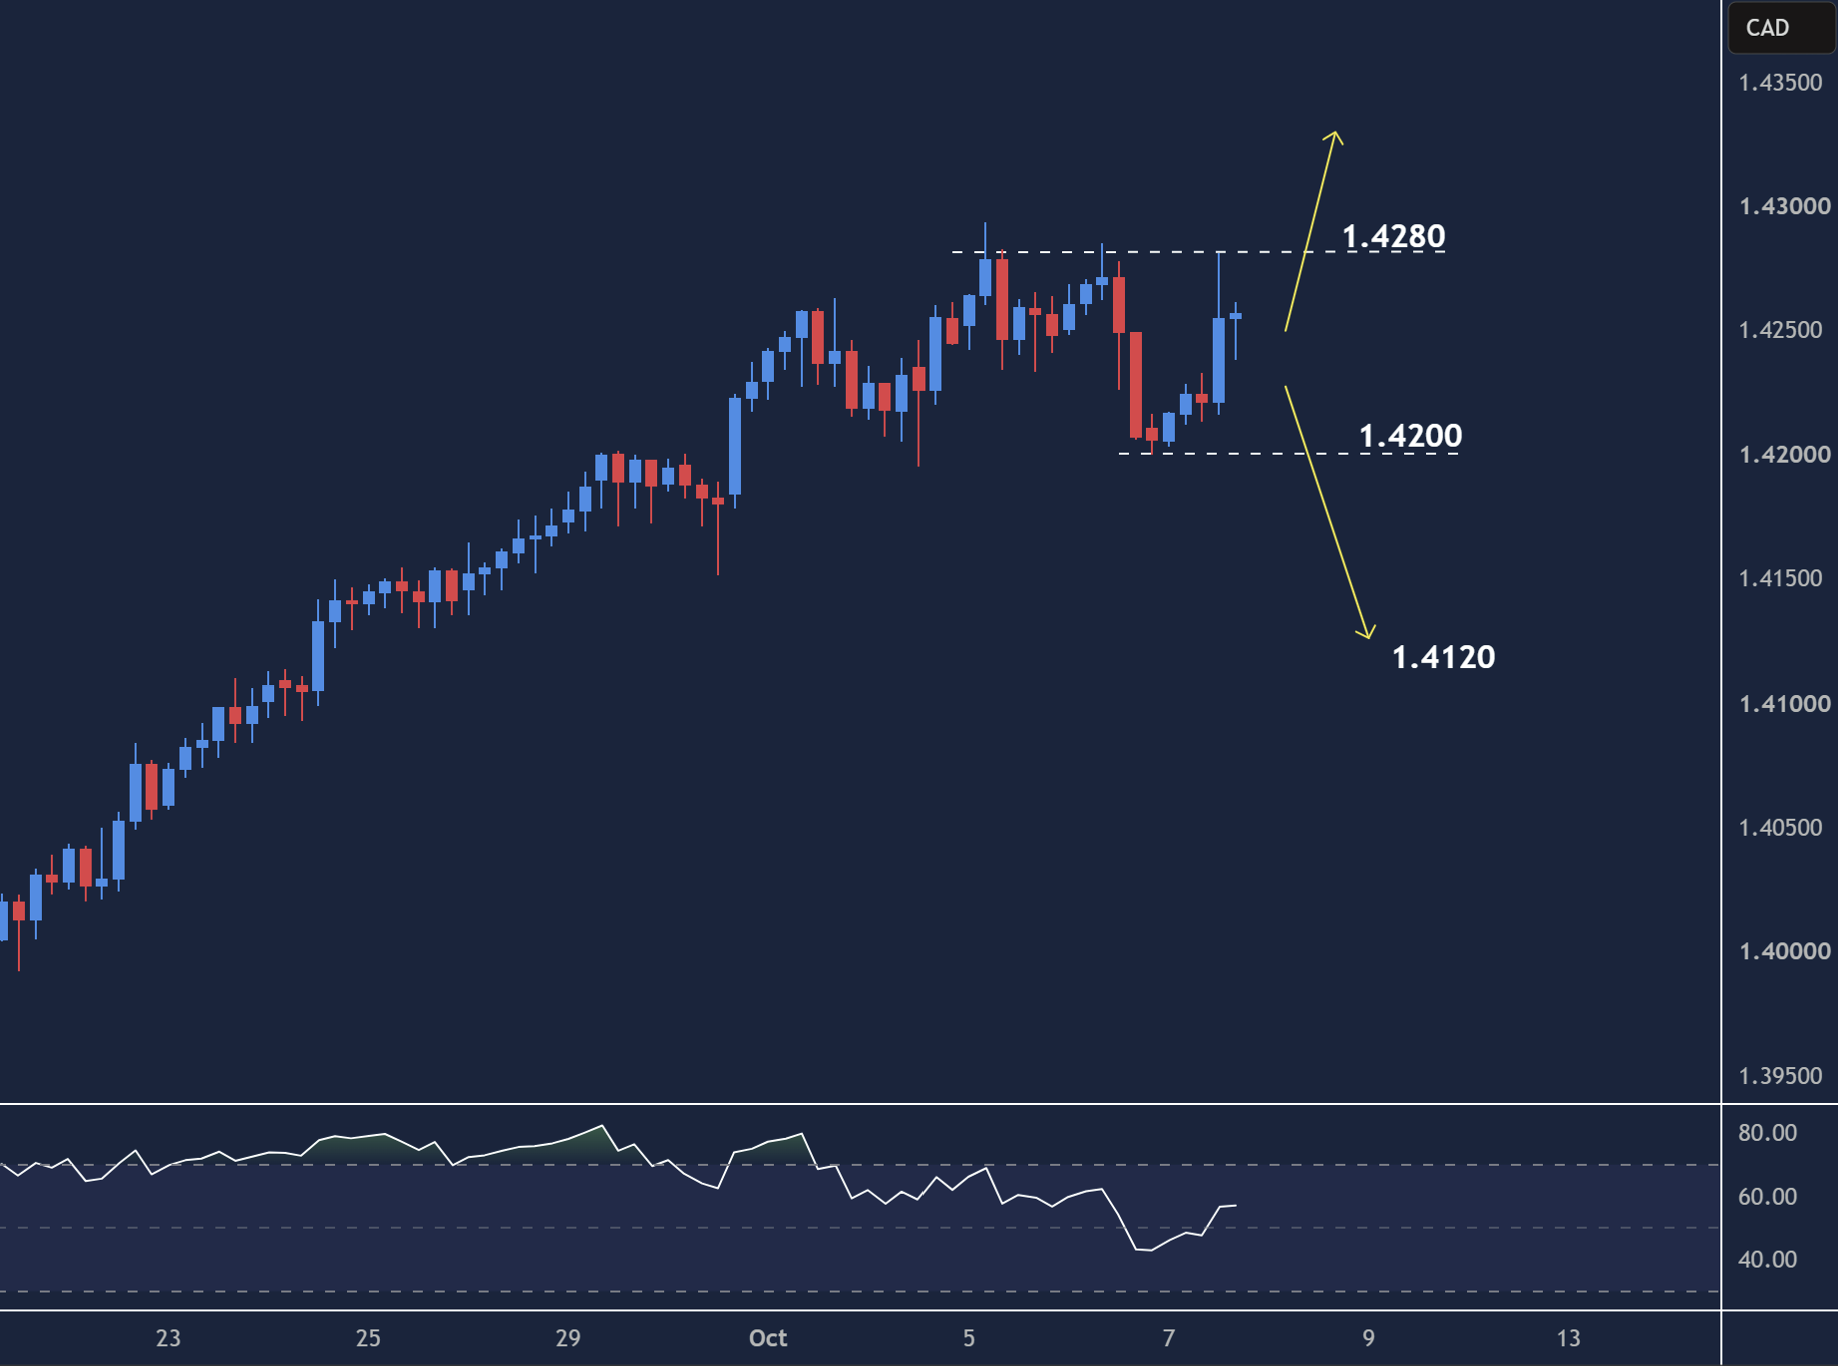
The US dollar remains in an uptrend after a brief dip to test 1.4200.
Prices are now testing the 1.4280 area, a major ceiling that so far has capped the greenback’s advance.
A breach would signal the bulls remain in the game, with 1.4350 a potential target.
As the RSI shows a pullback, this is a test of buyers’ resolve, with 1.4200 as the first support and 1.4120 as a second layer.
AUDUSD stuck sideways
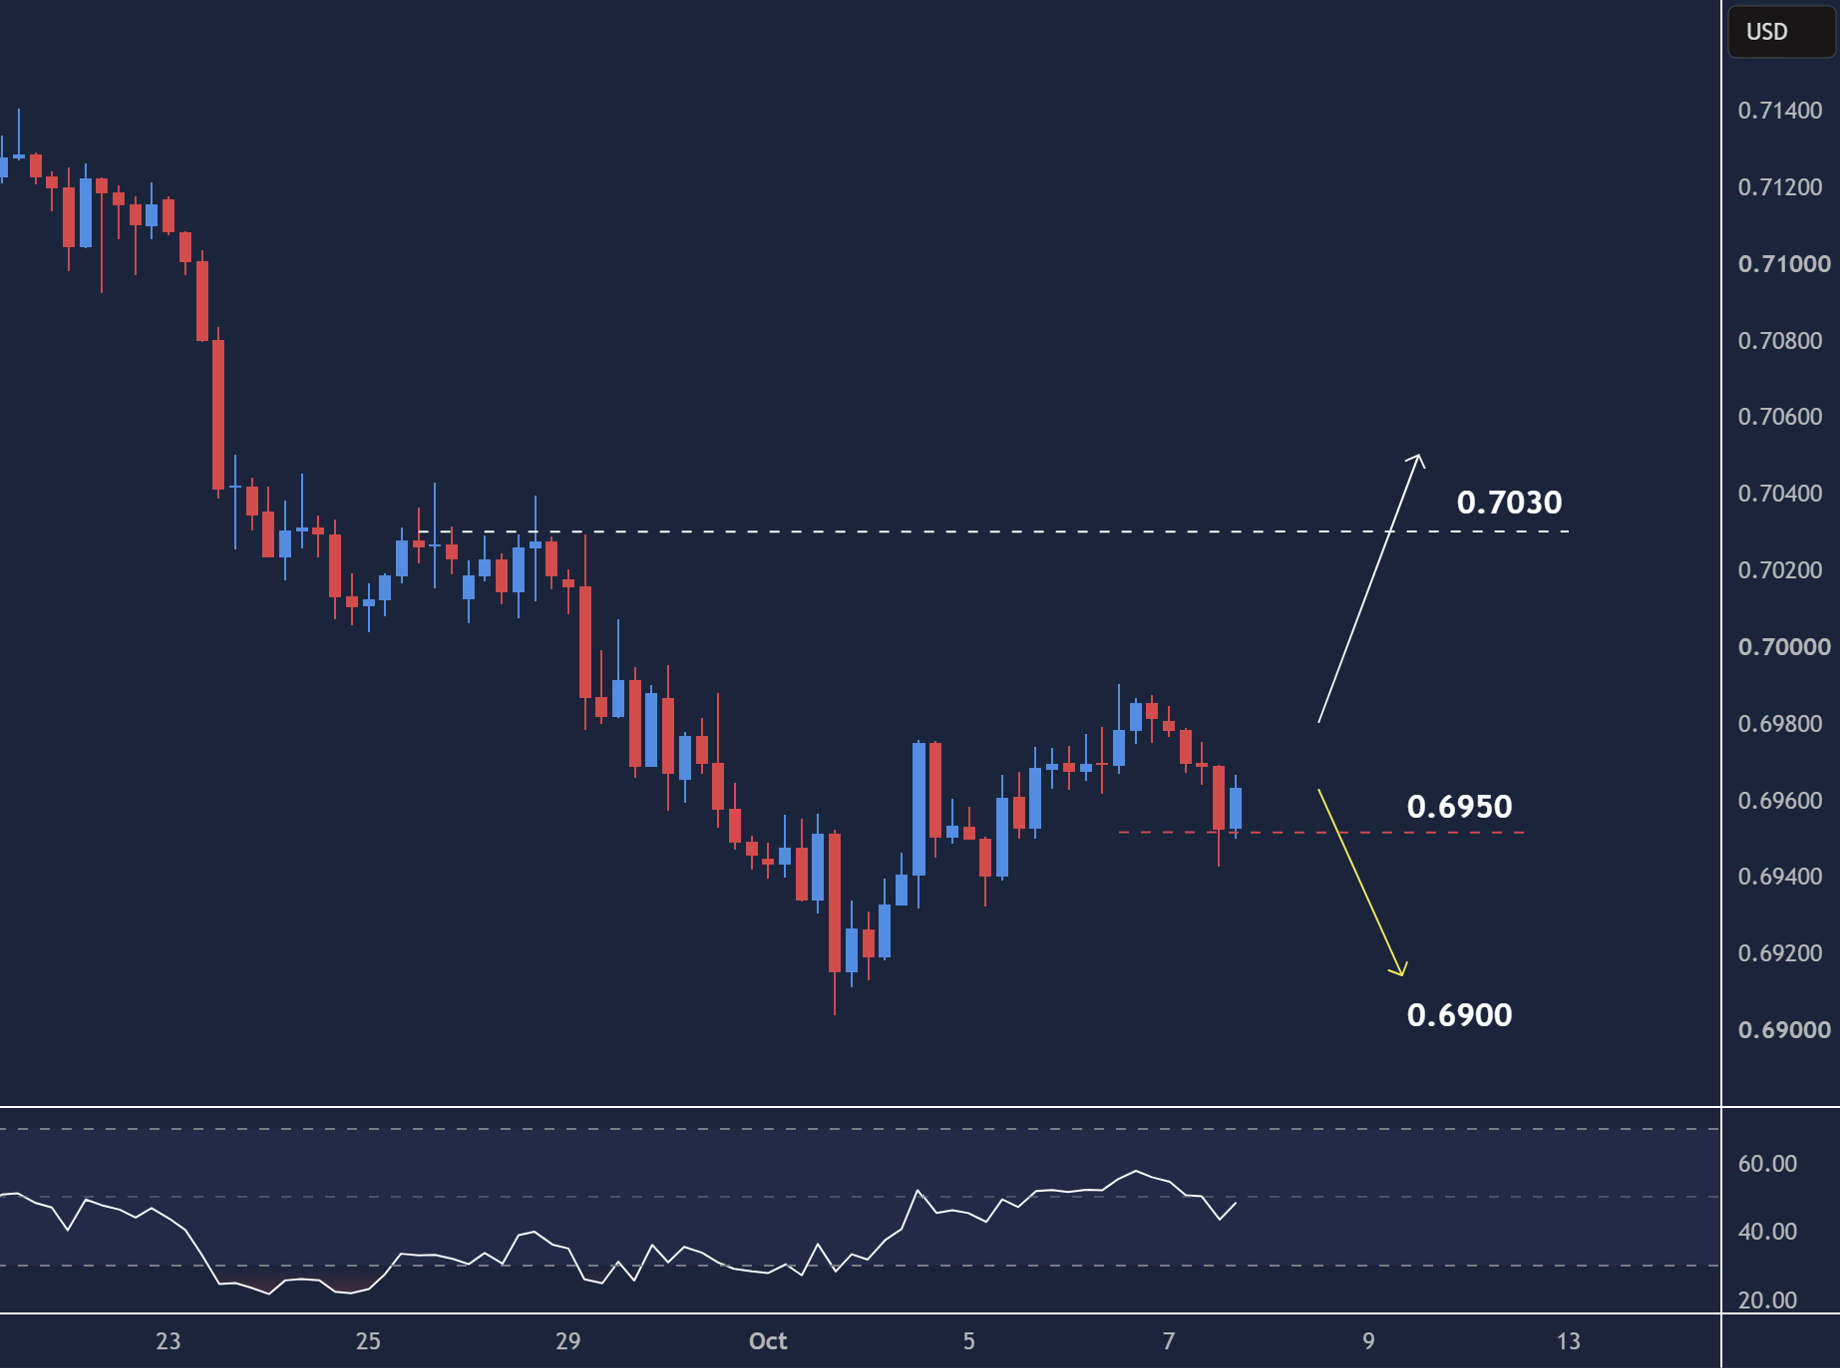
The Australian dollar clawed back losses after the September sell-off threatened to drive prices lower.
The pair is looking to move back towards 0.7030.
A preliminary bounce at 0.6950 is pushing some selling interest out of the way.
0.7000 is a major resistance to lift to instil confidence and open the door to a broader rebound.
On the flip side, a slip below 0.6950 would trigger a sell-off towards 0.6900.


Comments
Log in or sign up to join the conversation.