


US 30 remains pressured
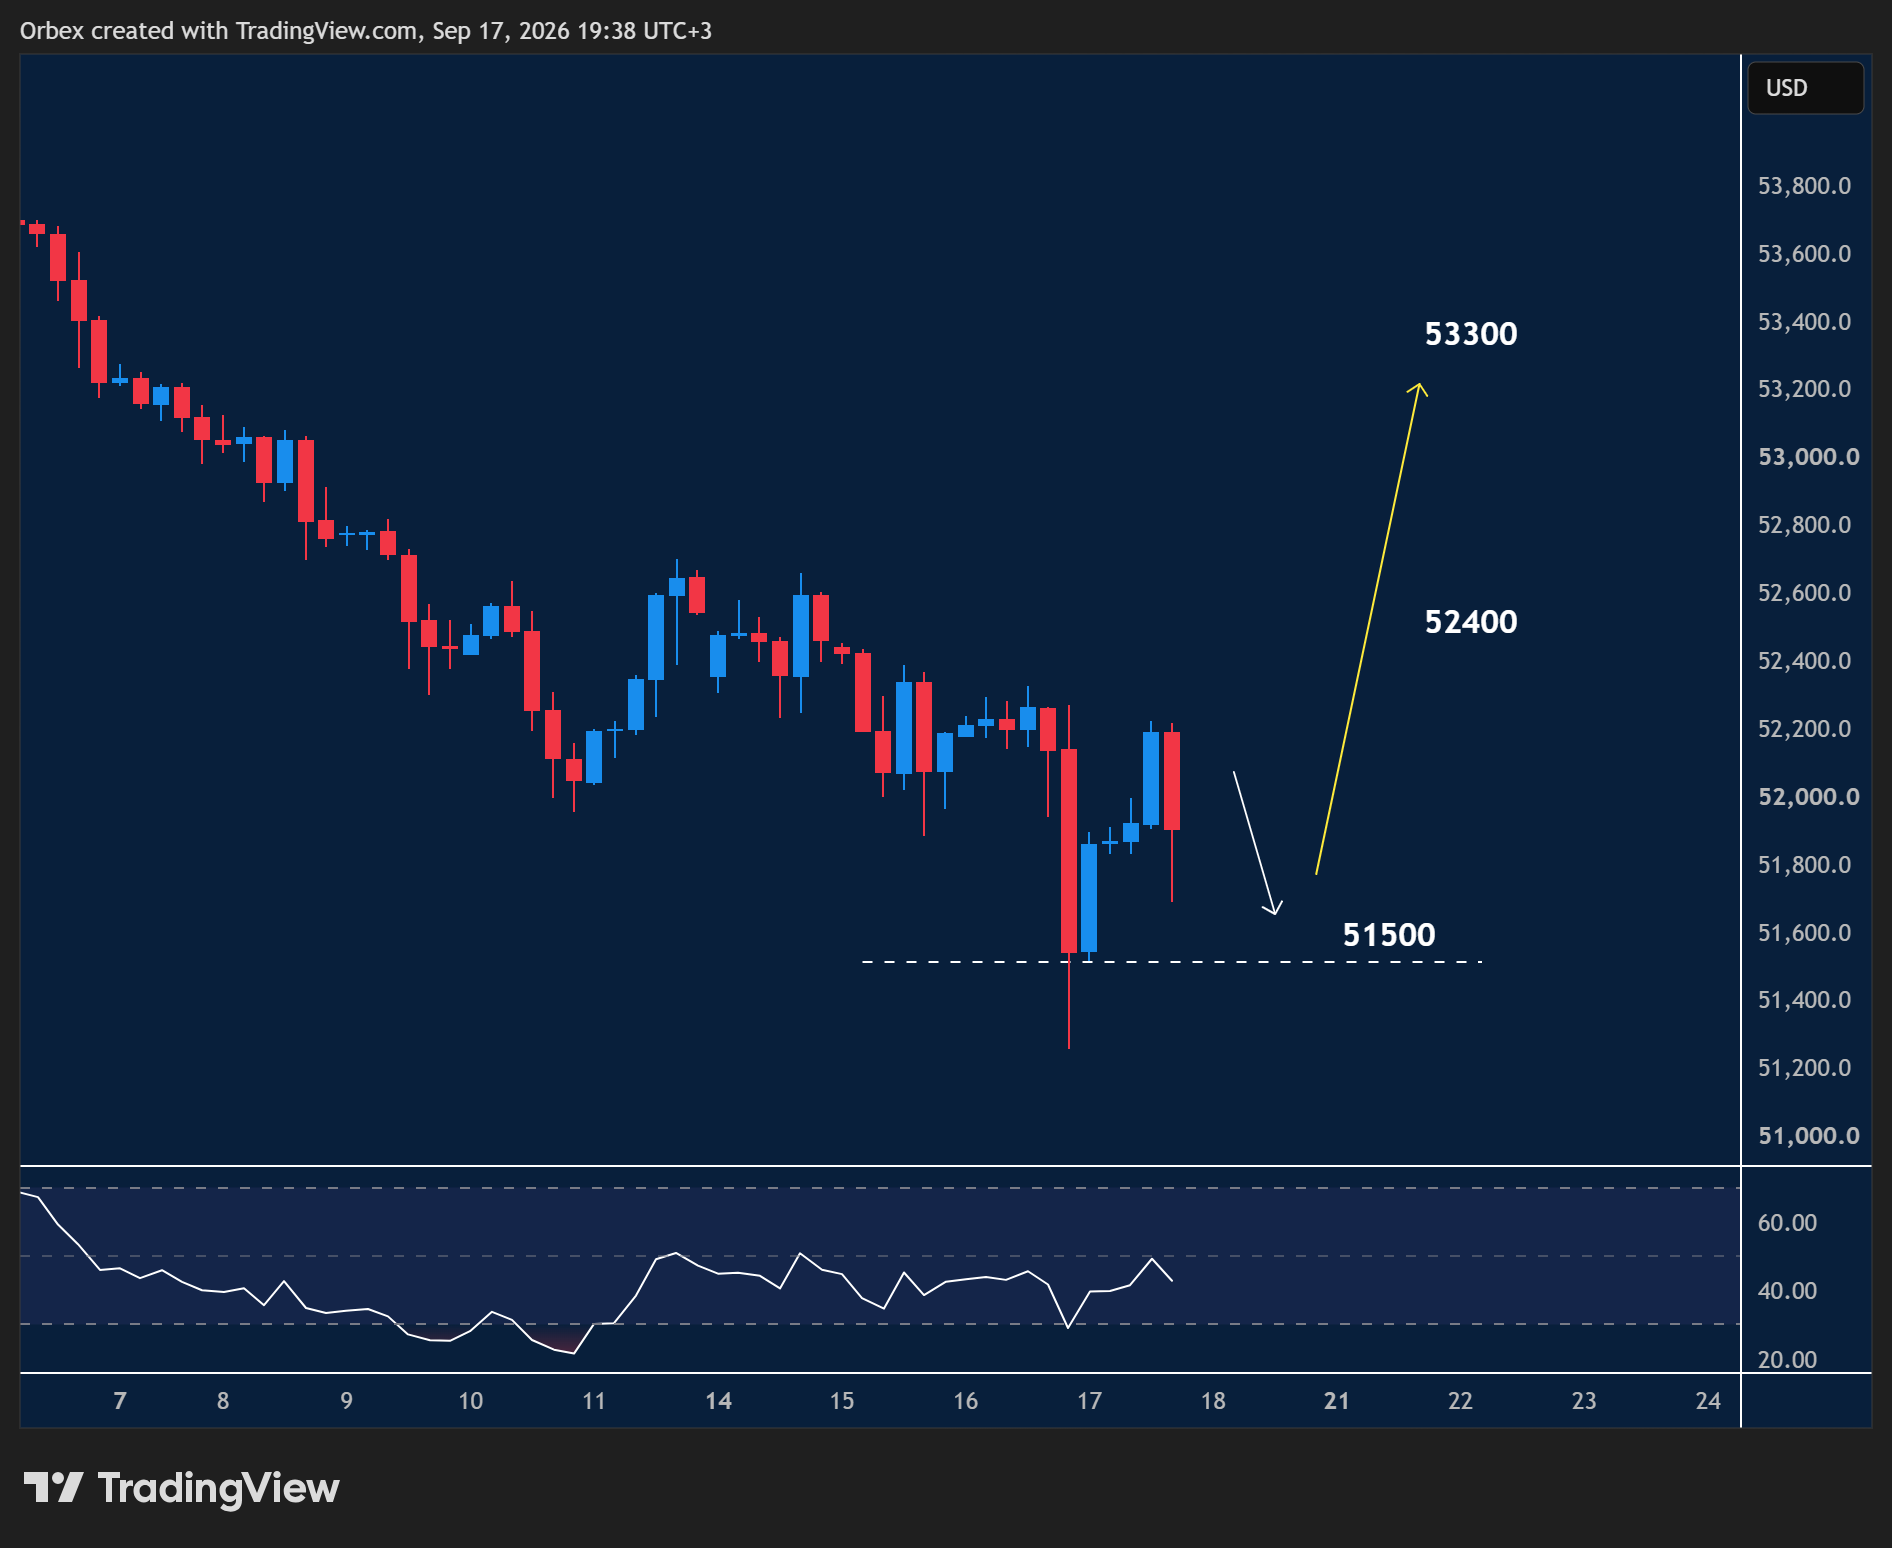
The US 30 retreats after falling another 500 points as indices across the board lick their wounds.
The mood around the US 30 remains cautious, with 51500 becoming a critical support.
A drift below 52000 put traders on the defensive, but could be an opportunity for early buyers to take profit.
For the US 30, 52400 is the level to see if buyers will support the market.
A break at 52400 would expose the next target at 53300, keeping the US 30 under pressure.
USDCAD hits psychological resistance
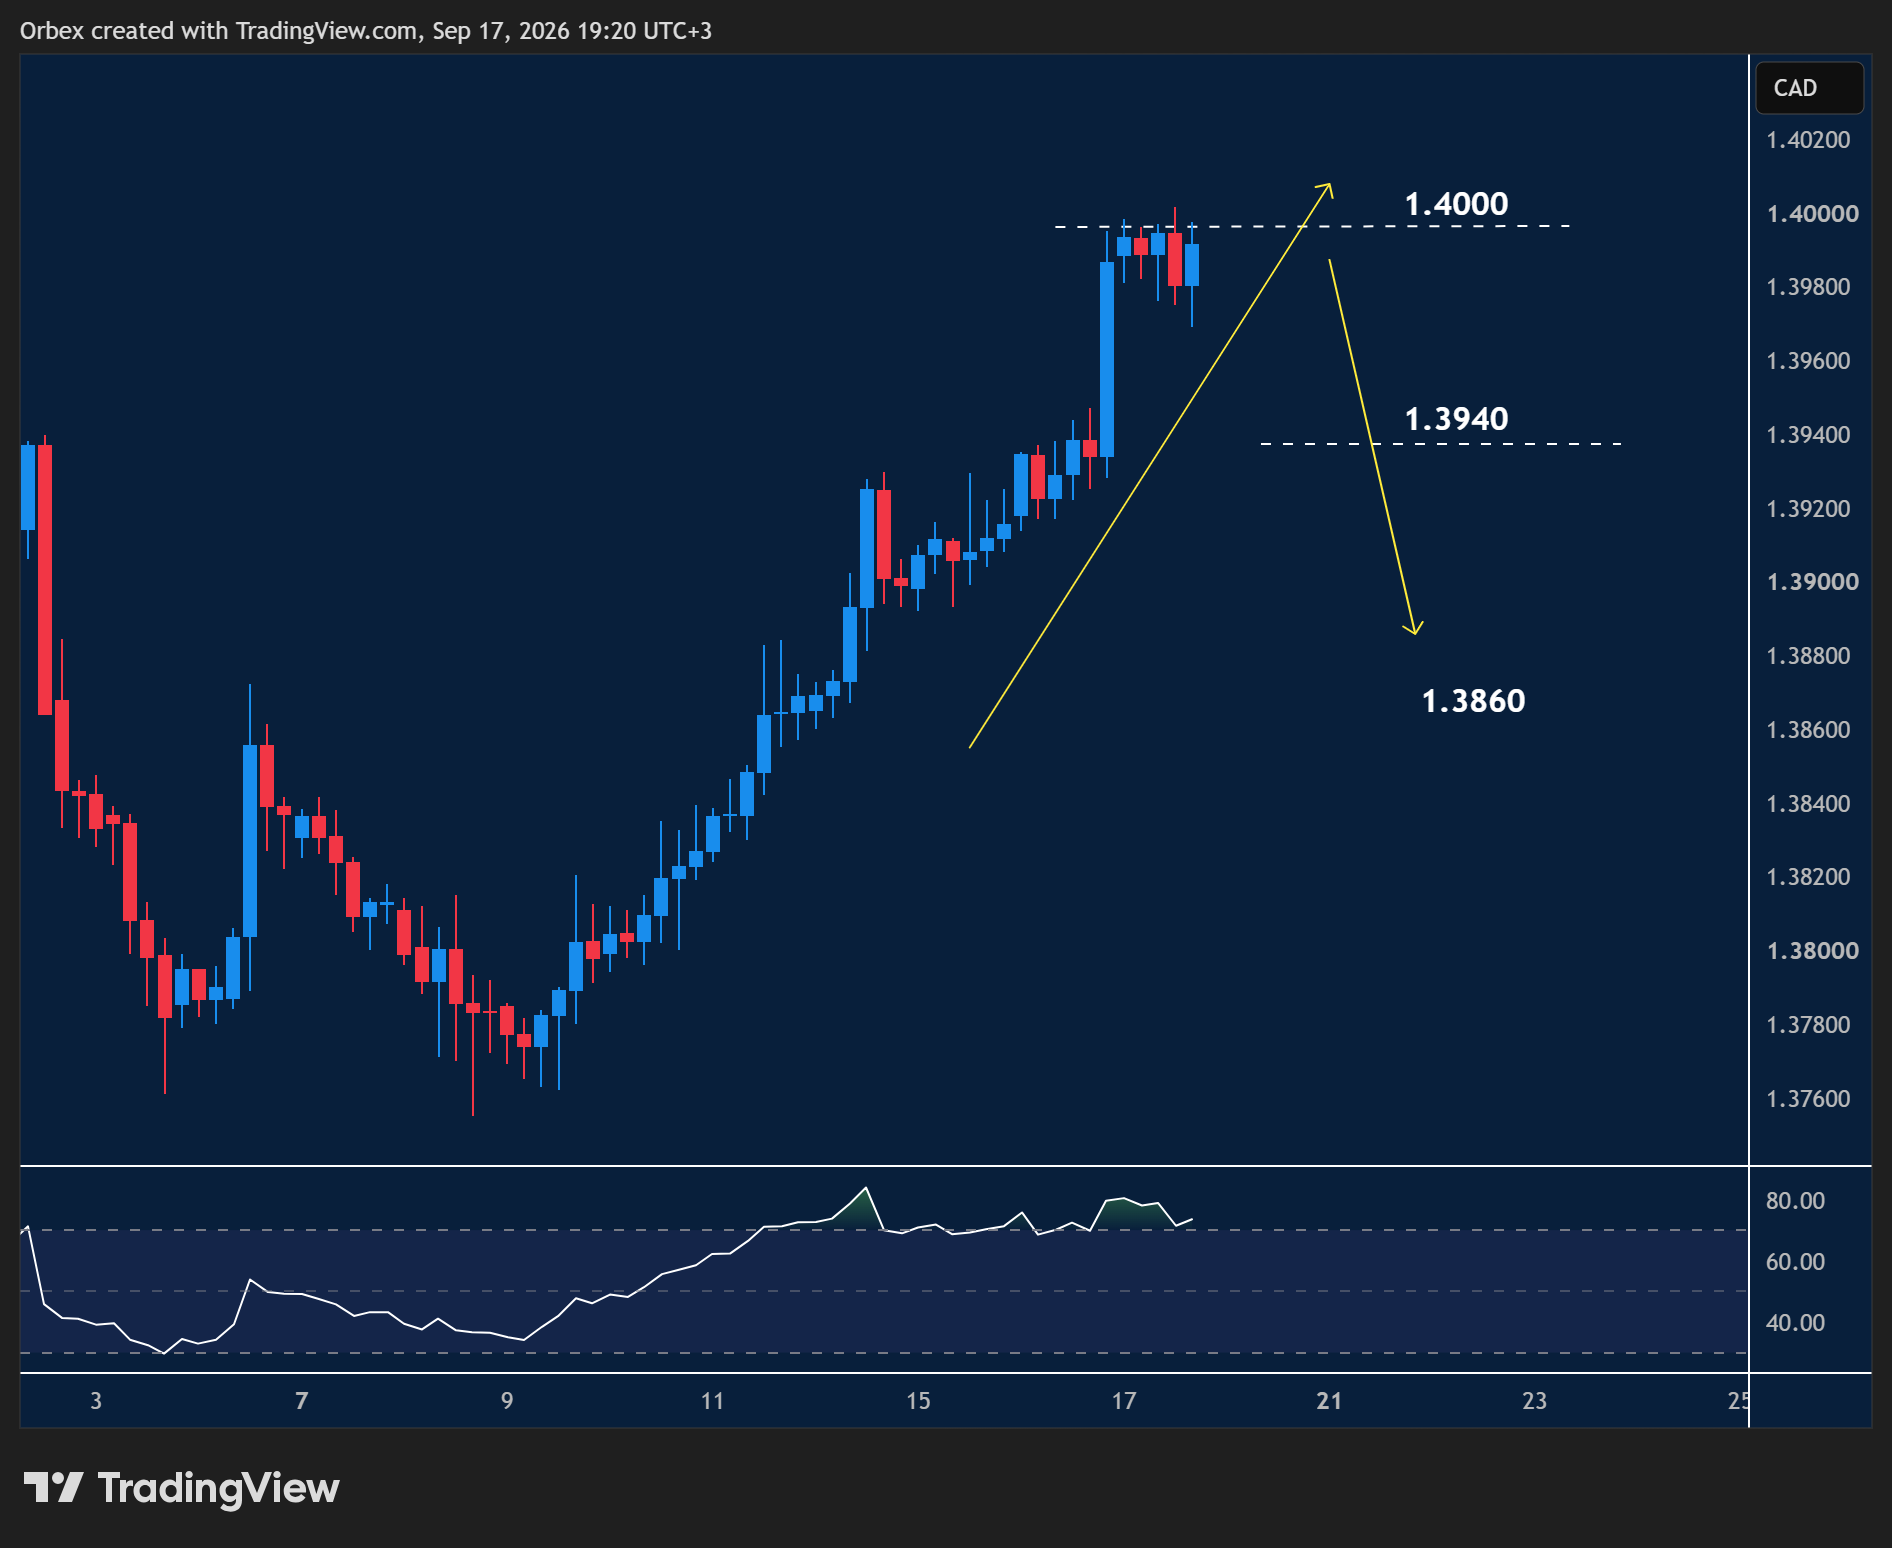
The greenback stepped back as the pair hit a new multi-week high after the Fed’s rate decision.
Price action took a breather at 1.4000 as buyers covered their bets, forming a consolidation.
A bearish pullback would turn the tables by confirming the ongoing overbought RSI status.
1.3940 then 1.3860 would be the next target lower if a reversal ensues.
EURGBP shifts higher
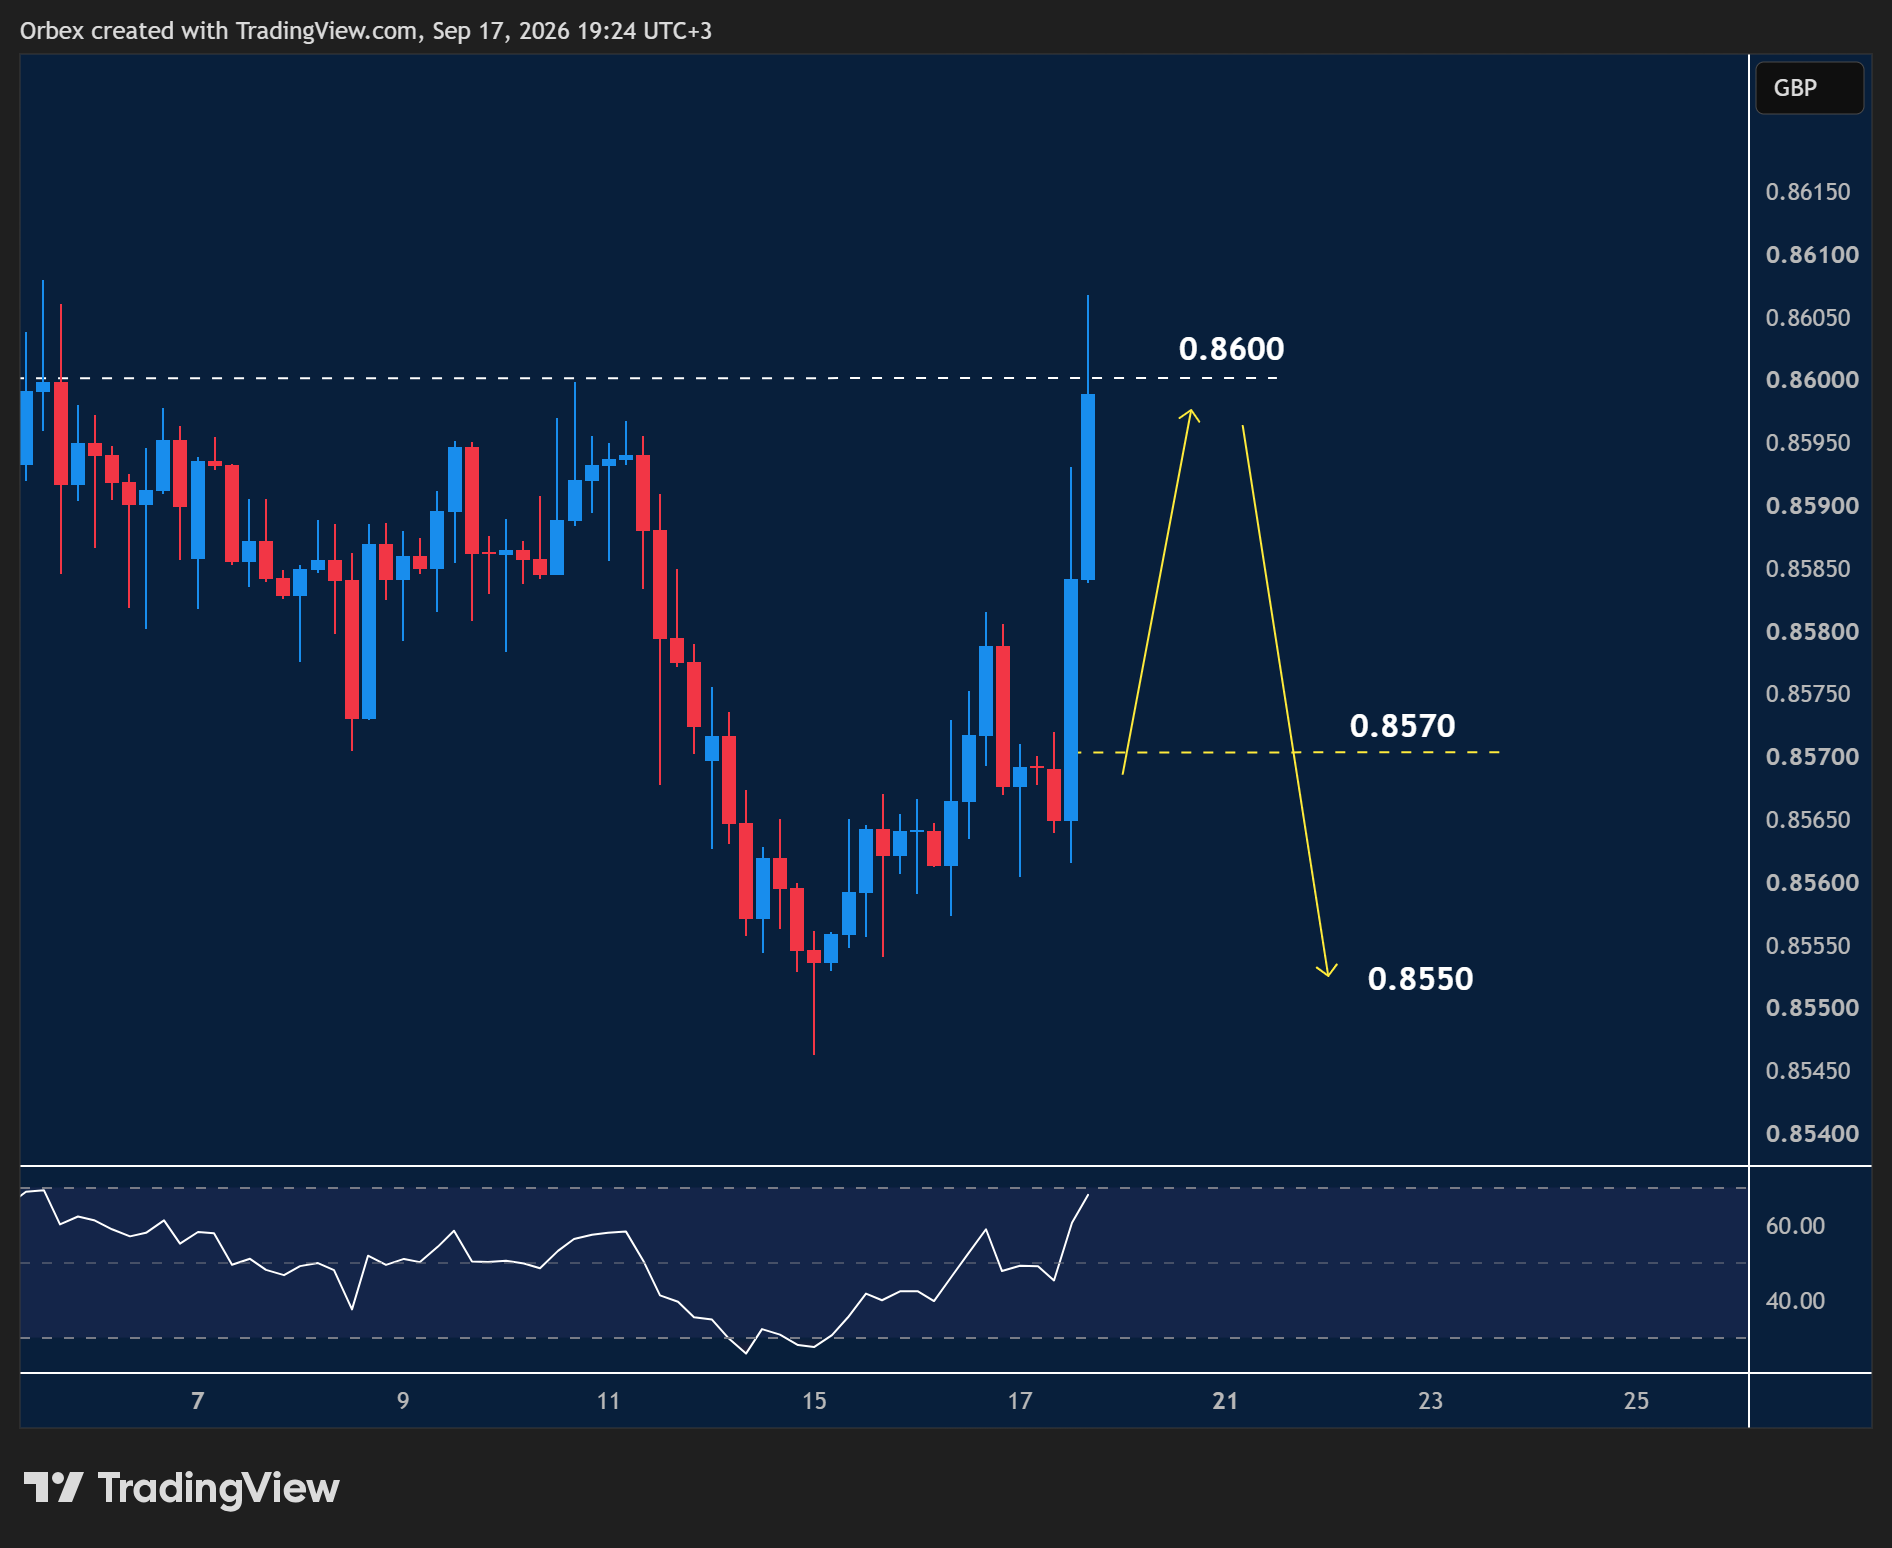
The euro advanced after prices jumped over 50 pips to reach a fresh high.
With price securing a foothold towards 0.8600, bulls will look for confidence to push higher.
Failure to break past 0.8600 will put buyers under pressure.
A bearish breakout could trigger an extended rally past 0.8570.
0.8550 is a critical floor if a sharp turnaround sends prices lower.



Comments
Log in or sign up to join the conversation.