
EURUSD Yesterday’s chart analysis
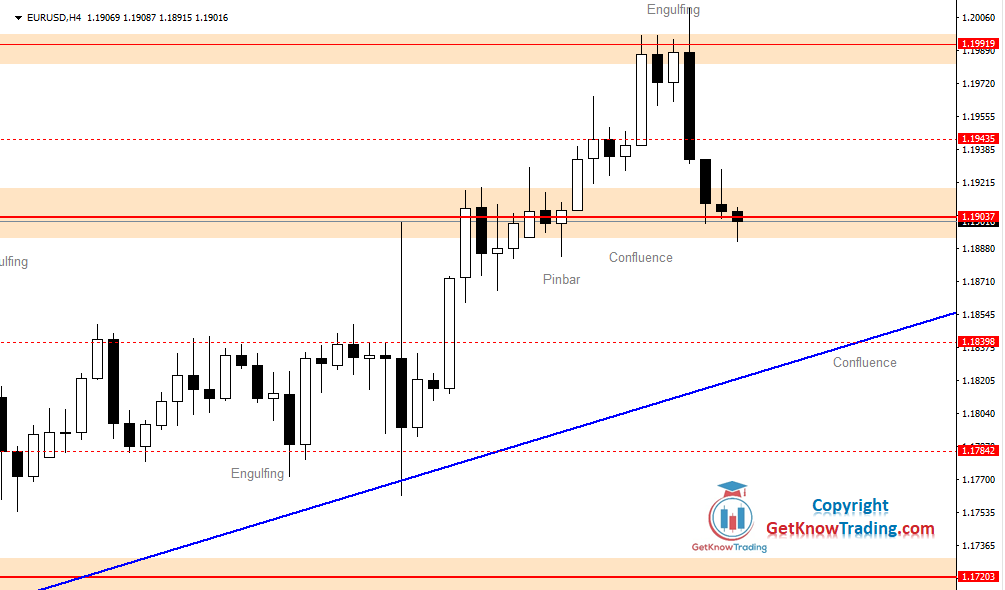
We had a nice push to the $1.2000 level when the price reversed down almost 100 pips. After the break above the $1.19000 level we had a bullish Pinbar that took the price to the first resistance level at $1.19435.
At that level, we had inside bars after which the price breaks out and found its way to $1.20000.
At the $1.20000 the price has found strong resistance from where the sellers pushed the price down to $1.19000.
A strong bearish engulfing bar with more than 50 pips on the EURUSD pair is a strong signal. The price needed only two trading sessions in a 4H time frame to bring the price 100 pips.
Strong selling happened on the New York trading session where the price has lost all gains accumulated during the European session.
(Click on image to enlarge)
EURUSD Chart Forecast
The price stopped at the first strong support area around $1.19000. This is the upper level of the range area in which the price has entered at the end of July and break out two days ago on August 31.
It will be the level at which the price will take some time before making a decision will it get back in the range area or it will try again to reach $1.20000.
The second support where the price could stop and make some bullish price action signal is at the $1.18398 level. This level acted as a support in the previous price movement.
That level is also a level of support confluence where the uptrend support cross with horizontal support.
One thing we should not rule out is the daily bearish Pinbar that has formed on the resistance level. It is a strong signal we could see the price move down.
The first daily support is also at $1.18398 level which confirms 4H time frame analysis.

Comments
Log in or sign up to join the conversation.