

EUR/USD Yesterday’s chart analysis
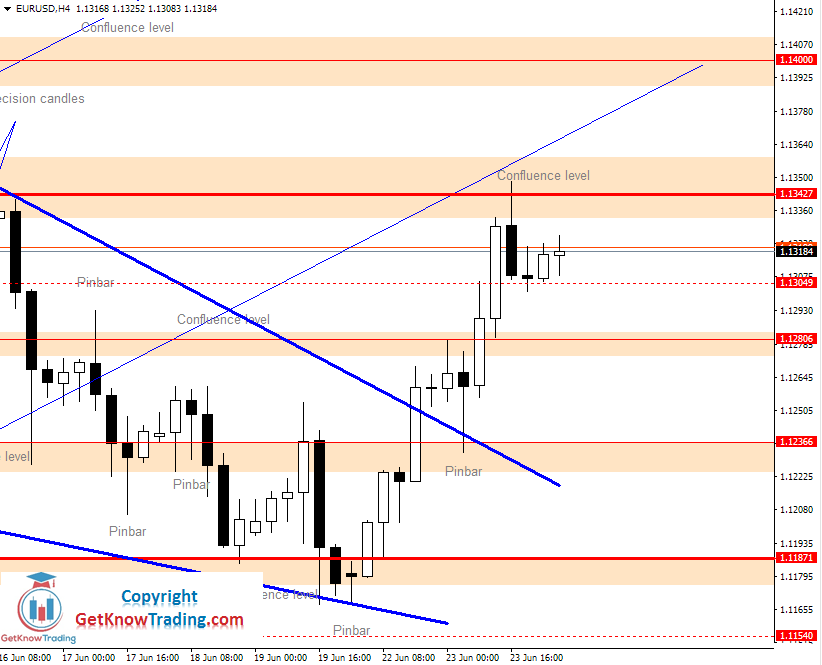
EUR/USD after the breakout from the wedge pattern reached first strong resistance at $1.13427. Yesterday’s two strong bullish candles have drive the price very fast to the resistance level which indicates strong bullish momentum after the breakout.
$1.13427 level is now confluence level of uptrend resistance line and horizontal resistance line.
When the price reached the confluence level it pulled back to the first small support at $1.13049.
The confluence level is a strong resistance area which has stopped the price on June 16 and on June 5. Each time the price have pulled back so it was possible that the price do the same thing. For now, the price have pulled back, but very little. Only to the first small support at $1.13049.
If you read closely then you can translate this behavior as a bullish power that do not allow the price to make a strong pullback.
EUR/USD Chart Forecast
With a strong bullish momentum after the breakout from the wedge pattern, I am expecting the price to move further up. The current confluence of resistance will be hard to break, but it will happen eventually.
The price is currently in the indecision which is shown through candles that have formed on the small support level. What the price will do, we need to wait and see what will happen.
My direction is still bullish until the price is above $1.12366 level. Whenever the price makes a pullback to support level I am watching to make a buy when the clean price signal appears.
If you have entered into the trade from yesterday’s analysis and from the entry signals I have sent through G-Trader member list, then you have reached the first profit target.
Today I am watching how the market will behave and where to enter. There are certain areas where the possible signal can appear and where it would be nice to enter.



Comments
Log in or sign up to join the conversation.