
The price has been making indecision candles in the area where several candles did not manage to close above or below which would open direction for the future movement.
From yesterday’s analysis, it took two more candles to break out, in this case, break above, where one large bullish candle took the price all the way to resistance at $1.13427.
If you move to the H1 time frame you will see there are many small bullish Pinbar’s that pointed out that the price could move up.
That area where the price was filled with buyers preparing for the move. And when a move happened, the price moved very fast and very high.
Now, the price has stopped on the resistance level and is looking for a further move up.
(Click on image to enlarge)
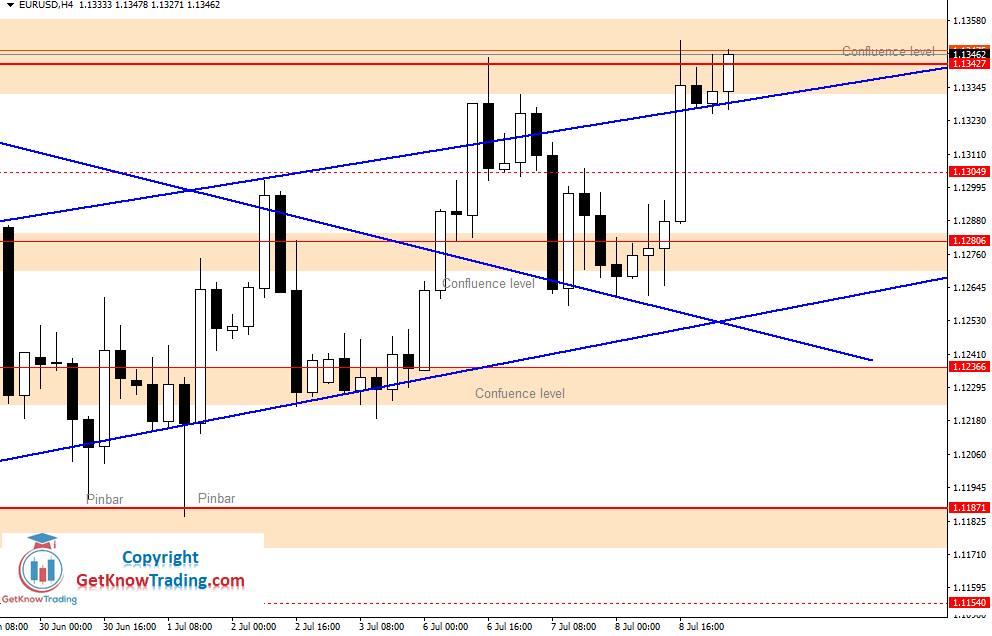
EURUSD Chart Forecast
The price did not have so much power to go up more and close above $1.13427. It stopped at that level, but as we can see the candle formation is showing there is no bearish power. Only one small bearish candle, but we need to be careful.
The current level is tested for the fourth time in the last 20 days, since June 16. It is at a significant level, so there could be some problems for the bulls to take the price higher.
The current level is a confluence where the price is close outside of the uptrend channel which could mean the next resistance at $1.14000 is very close. Will it be a false break out from the uptrend channel or not, we will see what will happen.

Comments
Log in or sign up to join the conversation.