

EURUSD Outlook
EURUSD Yesterday’s chart analysis
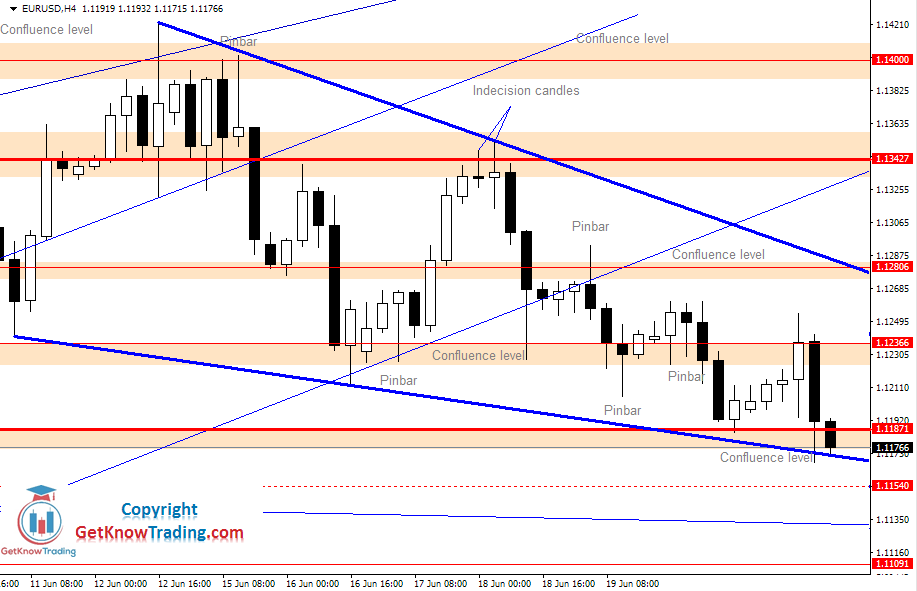
In yesterday’s analysis, I have pointed out that we could see a pullback to $1.12366. The price did right that and returned back to support at $1.11871.
When the price touched $1.12366, it bounced back strongly with only one bearish candle that engulfed five previous bullish candles. This tells me that the bears are strong at that level and the bulls will need a lot of power to break that resistance.
Looking at the daily time frame I can see bearish Pinbar. Looking at the weekly time frame I can see bearish Pinbar (weekly Pinbar is not perfect Pinbar).
(Click on image to enlarge)
EURUSD Chart Forecast
The support at $1.11871 is a strong confluence level which will determine will the price move down or up.
On the chart, we can see a falling wedge pattern after a long uptrend. This combination makes this wedge as a continuation pattern which means we should see the price moving up.
We can see the head and shoulders pattern that is pointing down with 175 pip target. And there is a nice breakout from the H&S pattern with the pullback test.
(Click on image to enlarge)
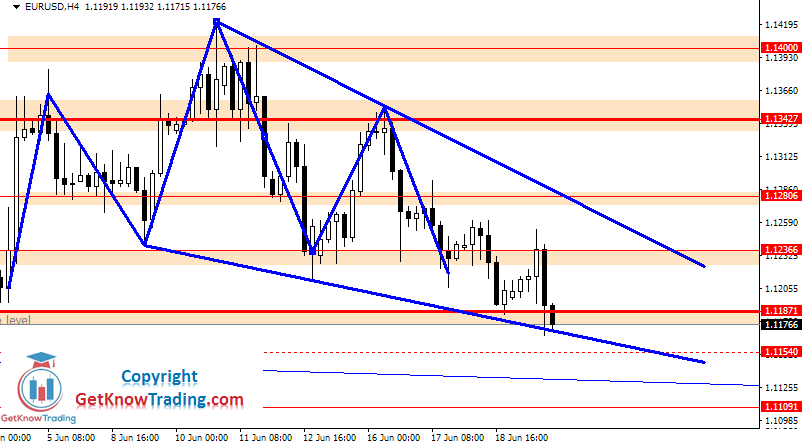
What I can see, many signals are telling me that the price is pointing to move down. Three major time frames are telling the price could go down. Only one, wedge pattern, suggest continuation for move up.
Entry EURUSD: If you want to see how to play this scenario join G-Trader
If you want to know how much pips EURUSD moves each day in a week or how much it moves on London or New York trading session, you should check this article: EUR/USD Pip Range Analysis



Comments
Log in or sign up to join the conversation.