

EURUSD Outlook
EURUSD Friday’s chart analysis
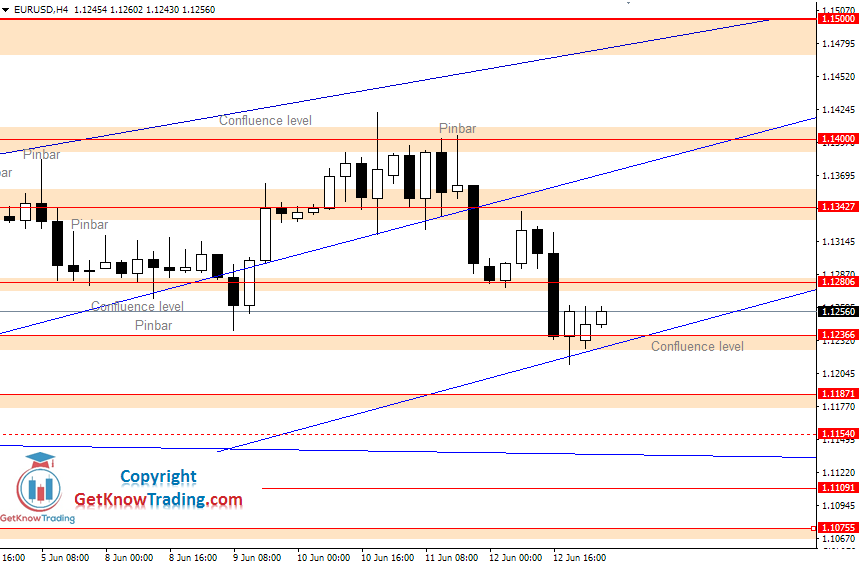
EURUSD has slid down to strong support level at $1.12366 which was said on Friday’s analysis that it could happen. I have announced that we should wait for the price pullback to $1.13427 and wait for the bear price action signal.
Bearish Pinbar has formed on the H1 time frame which was a clear signal for a move down.
EURUSD Chart Forecast
The price has stopped on the strong support level and on the uptrend line support. This level could hold the price for a while. As it looks like we have large Pinbar on the weekly W1 time frame suggesting move down.
The price has closed below $1.12086 which means bears have taken over and we could see price moving lower. We should wait for the price action signal on the strong resistance level and from there enter into the trade.
GBPUSD Outlook
GBPUSD Friday’s chart analysis
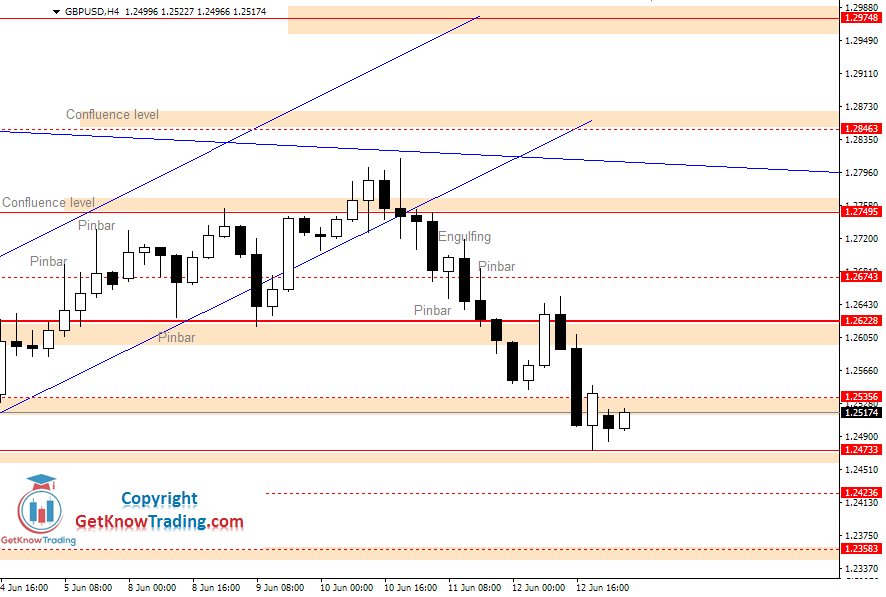
GBPUSD has acted just as it was predicted on Friday’s analysis. The price has pulled back to $1.26228 and made a bearish engulfing bar on the H1 time frame. From there the price has done all the way as was predicted, to $1.24733 level.
If you have followed Friday’s entry-level for GBPUSD, you could make 147 pips.
GBPUSD Chart Forecast
While the price has stopped on the strong support level at $1.24733, we can see a pullback. Pullback has done its way to the first small resistance at $1.25356. We see the price moving higher and making a bearish price action signal.
The price is currently between two levels that were holding the price from moving higher($1.26228) and from moving lower($1.24733). The price needs to close above or below to define further direction.
USDJPY Outlook
USDJPY Yesterday’s chart analysis
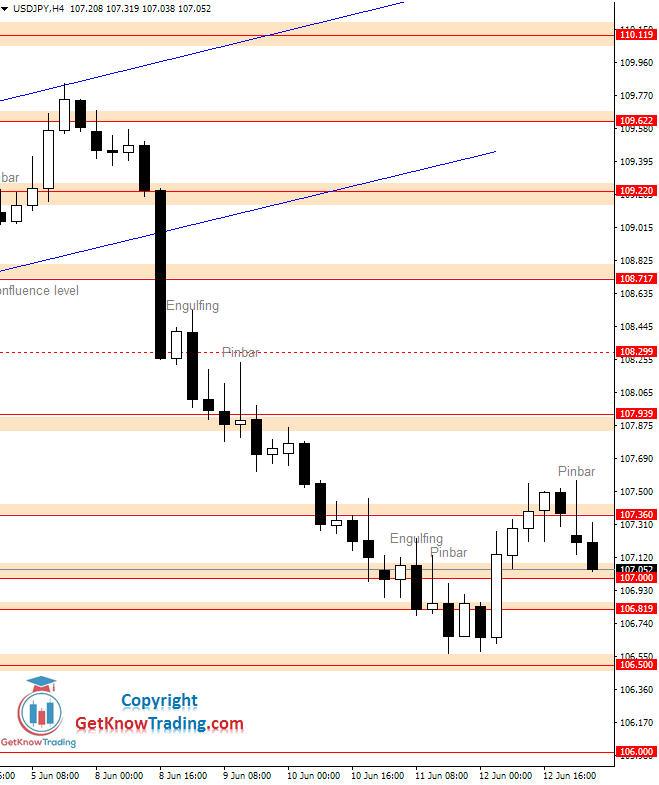
USDJPY have done a bearish scenario from Friday’s analysis. The price has pulled back from strong support at 106.50 to 107.36 and formed bearish price action signal with strong Pinbar. A strong bearish signal indicates we could see the price down again on 106.50. If sellers are strong then we could see the price down on the 106.00.
USDJPY Chart Forecast
While we are strongly in bearish sentiment that has started last week we should look for sell opportunities.
Strong H4 bearish Pinbar is a nice signal so we could wait for a small pullback from 107.00 level to 170.360. If the price manages to close below 106.00 level we could see further drop down to 105.55.
XAUUSD Outlook
XAUUSD Yesterday’s chart analysis
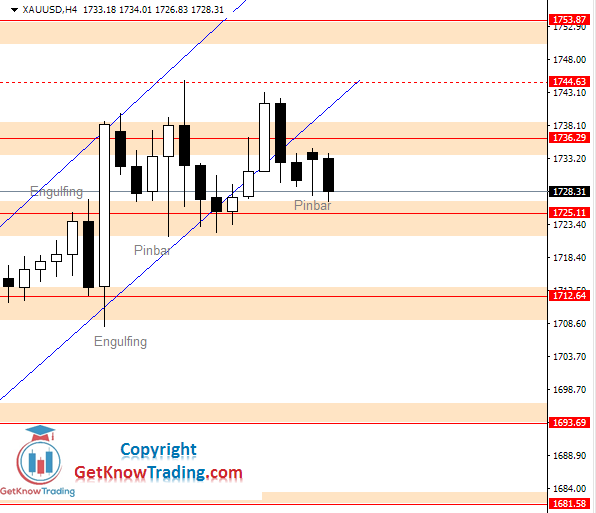
Gold is still in the indecision area between $1725.11 and $1736.29. Friday’s movement could not break and hold the price above $1736.29 level. The strong resistance level at $1744.63 did not allow the price close above which would expose $1753.87.
A bullish price action signal has formed close to $1725.11 which suggests we could see price moving higher. But, while it was a Friday all signals that appear on the chart we should take with caution. The reason is that the market on Friday does not always give a clear signal.
XAUUSD Chart Forecast
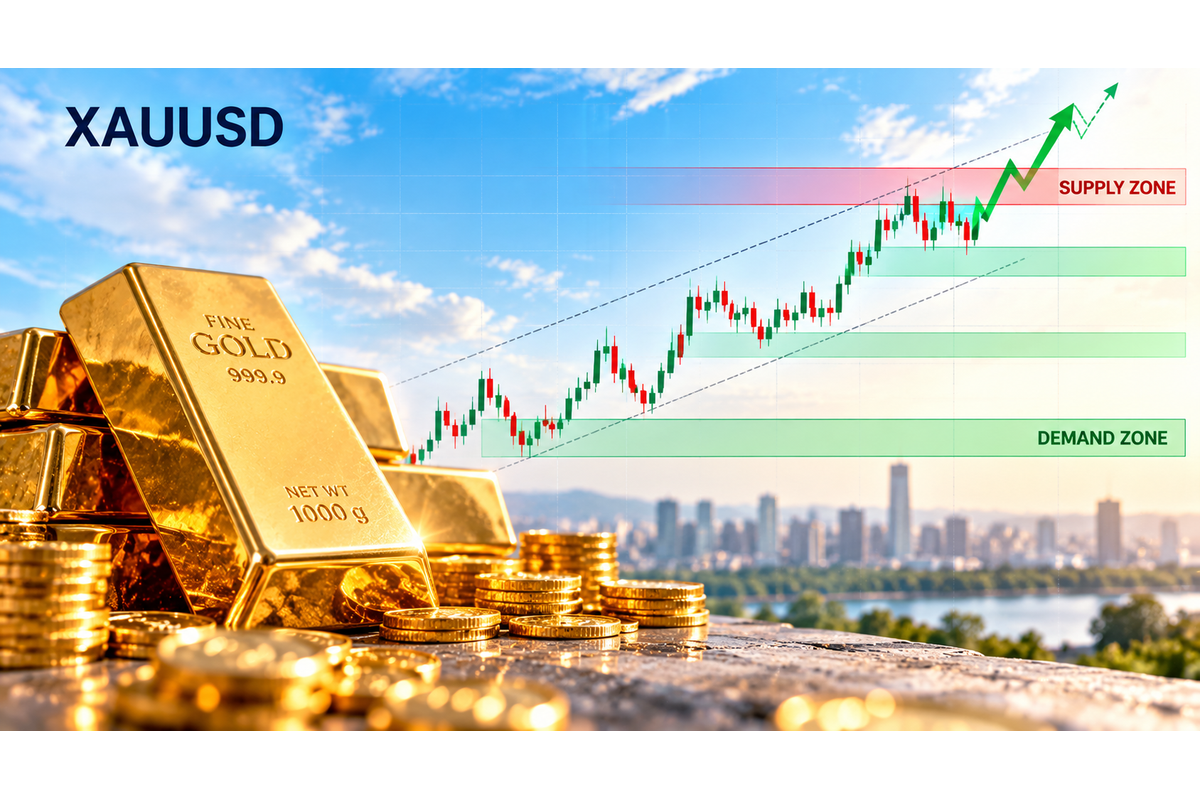
The price has stopped in the indecision area and it has gone out from the uptrend channel. This is a signal that has lost its momentum and it will need a strong buyer push to get back inside the channel and to continue moving up.
We need to have a strong bullish price action signal on the $1725.11 or around that level that will confirm further move up. While the price is above $1725.11 I am bullish on this pair.


Comments
Log in or sign up to join the conversation.