
EURUSD Yesterdays’s chart analysis
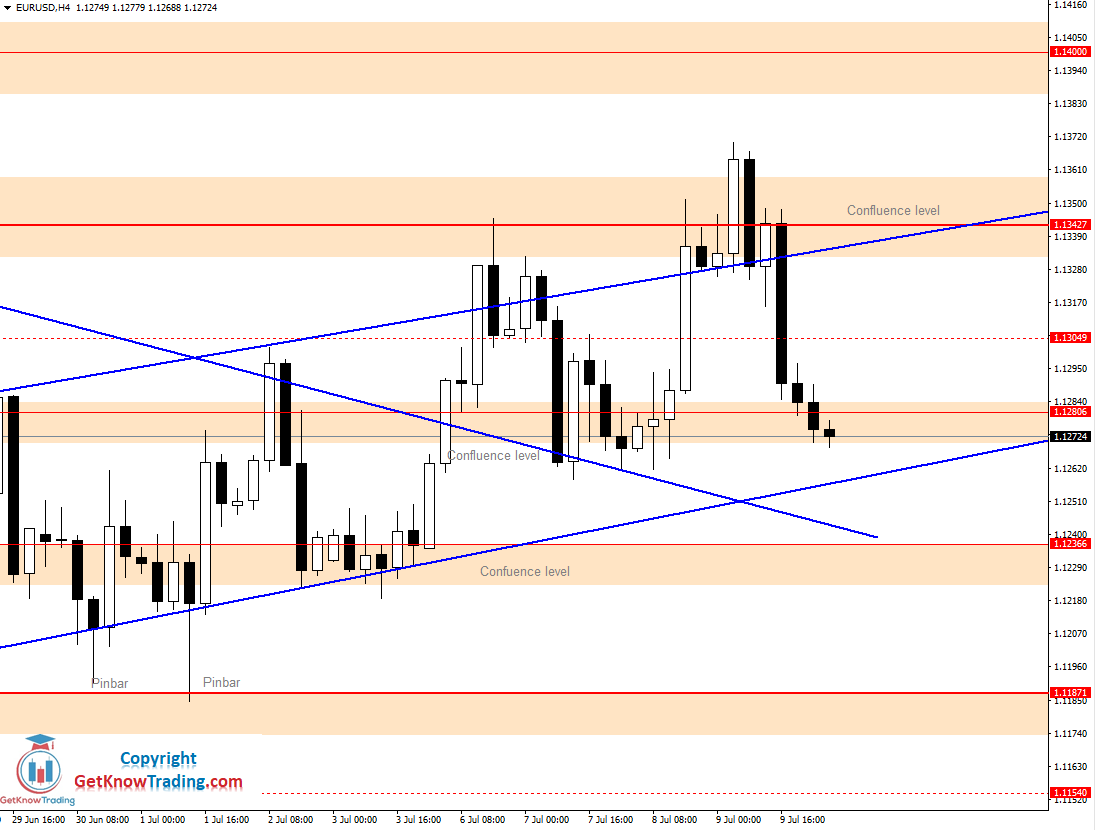
Yesterday was a day when we had a breakout from the uptrend channel. As was said in yesterday’s analysis and in the email I have sent to G-Traders, if the price breaks out we need to wait for the pullback and retest of the uptrend channel resistance line that is acting as a support.
Second-line was a horizontal resistance line at $1.13427 which is strong resistance and that could make a hard way to break above.
The price broke out and made a pullback, but the breakout was a false breakout. This trap took many buy orders and activated stop-loss where the price returned back in the channel.
The price has returned inside the range area I have talked about in June. That range area expands from $1,11871 up to $1.13427.
(Click on image to enlarge)
EURUSD Chart Forecast
Many times the price has tested range area horizontal and support lines, but up to now, there is no breakout from the area.
Currently, the price has returned back to the indecision area which was created on Tuesday this week. From there we needed to wait for the price to break out to see where it would go.
Today we have the same situation where we need to see where the price will move.
While we have a strong bearish candle, in the past we had similar candles where the price stalled and returned back. This same scenario we had on Monday/Tuesday this week.
Are we going to see the same scenario? We need to wait what will happen in this small indecision area where support lines are crossing.

Comments
Log in or sign up to join the conversation.