


USOIL shifts higher
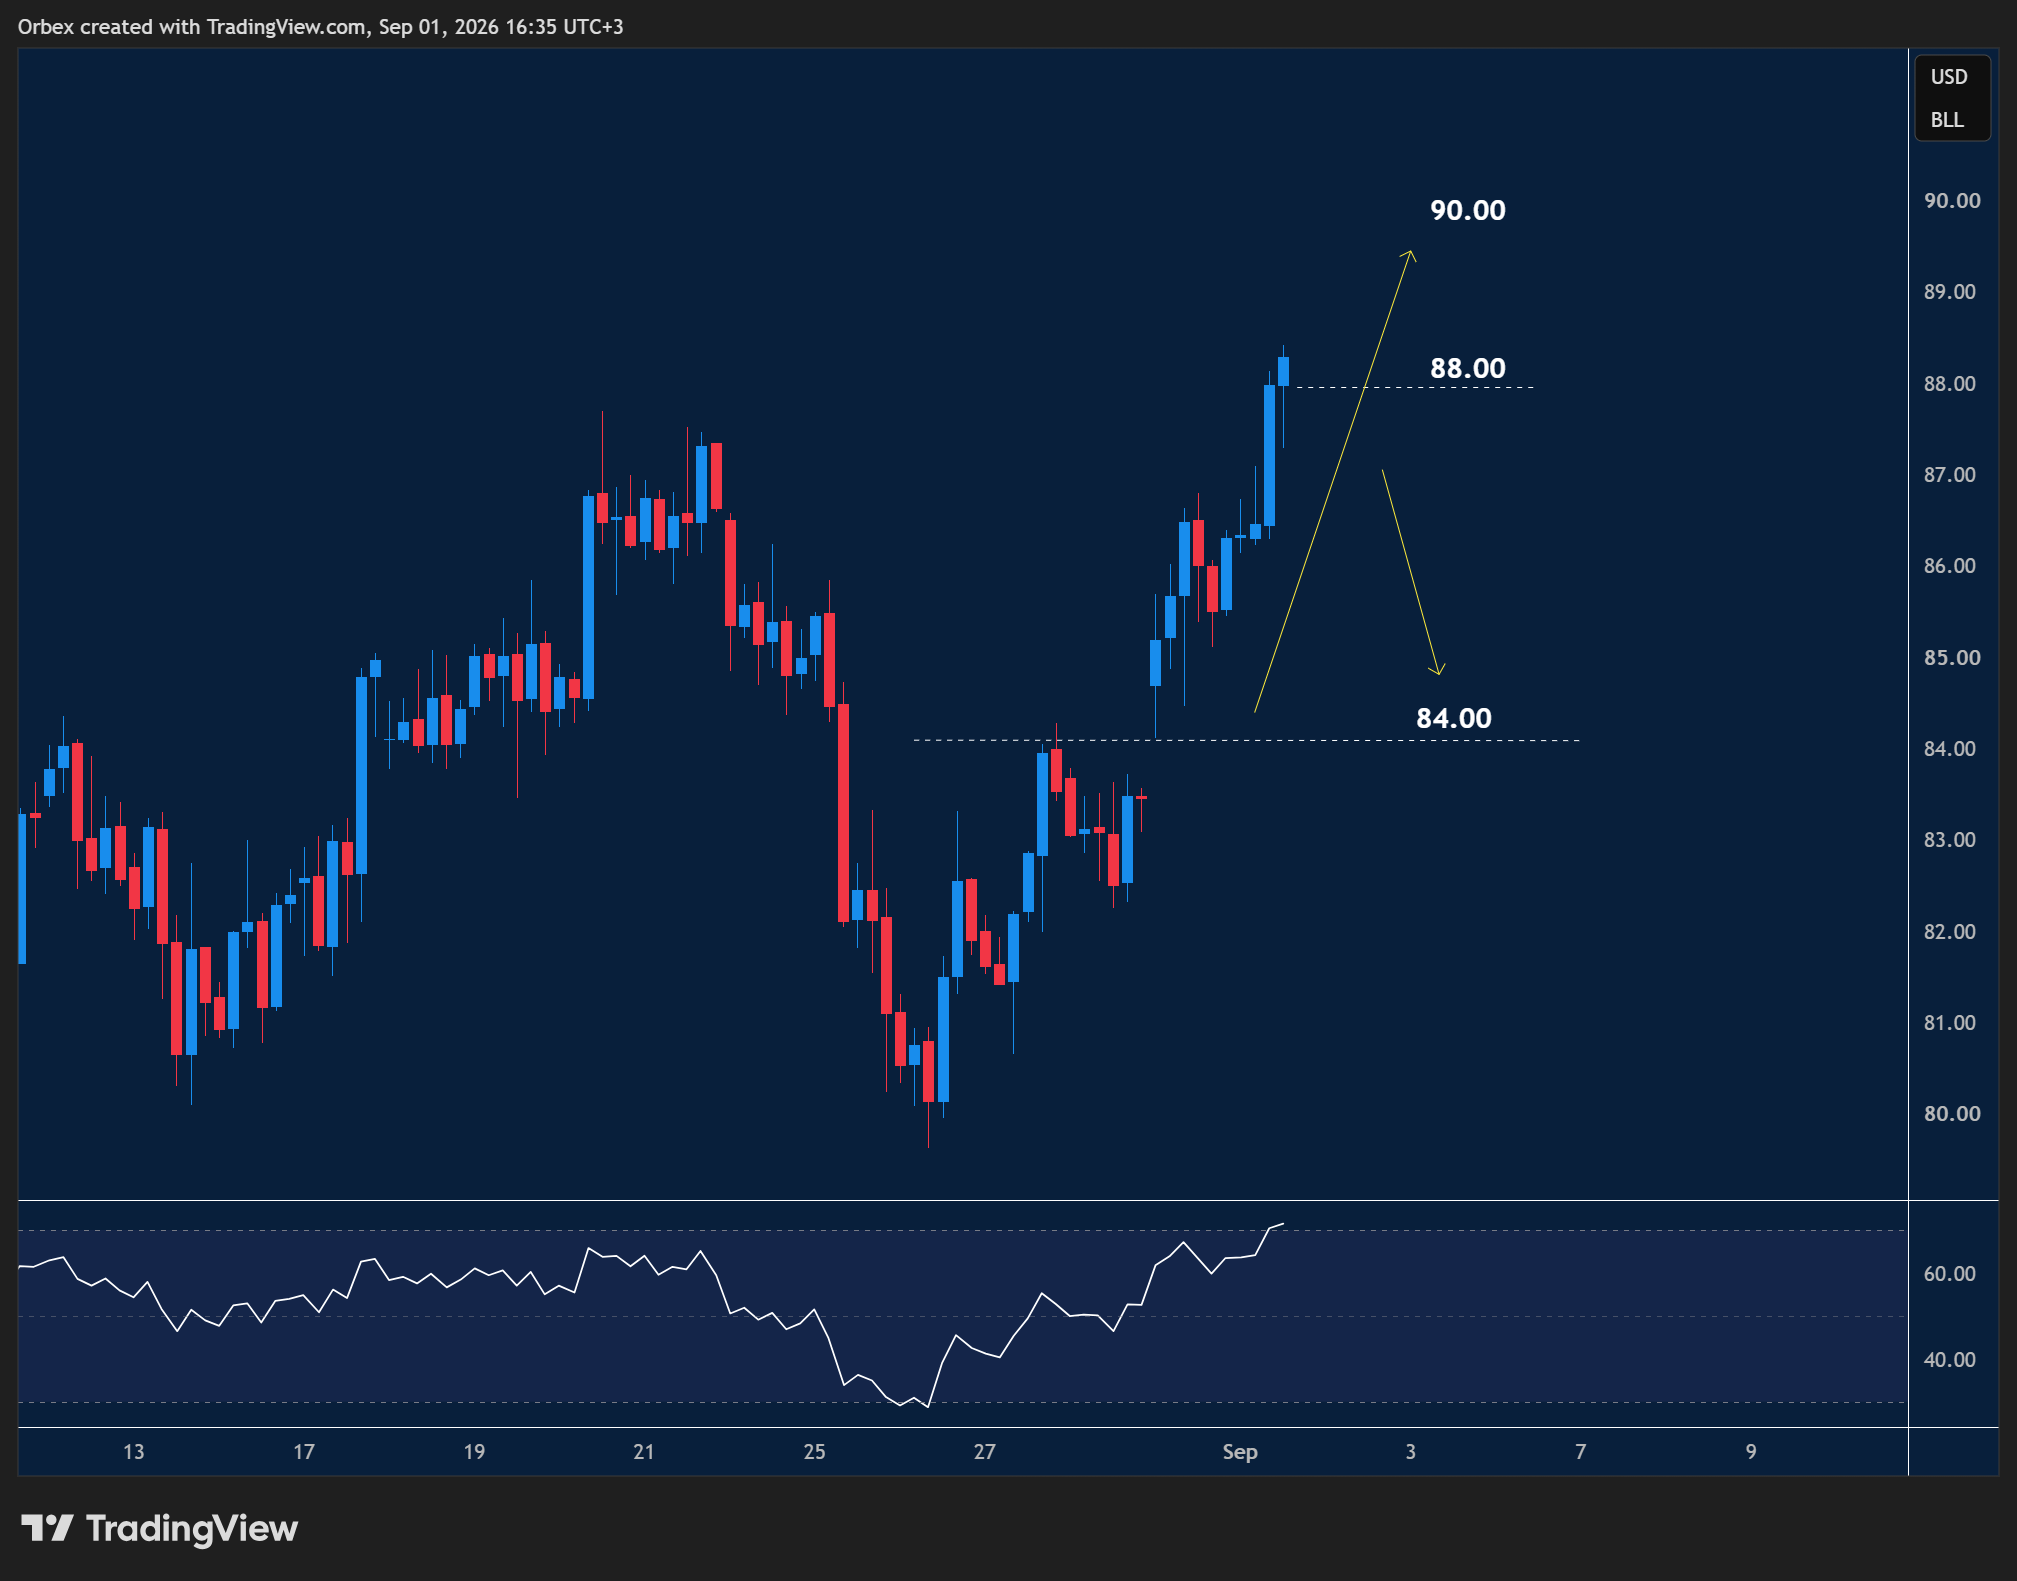
Oil (USOIL) maintains its bullish stance as tensions in the Middle East escalate.
A move above the major supply zone of 88.00 is a strong recovery signal with the ongoing shift in market mood.
90.00 is the next target as buyers attract more buyers.
Exhaustion on the rally would see a retracement back towards the mid-$85 area, with 84.00 being a critical floor.
GBPUSD finds support
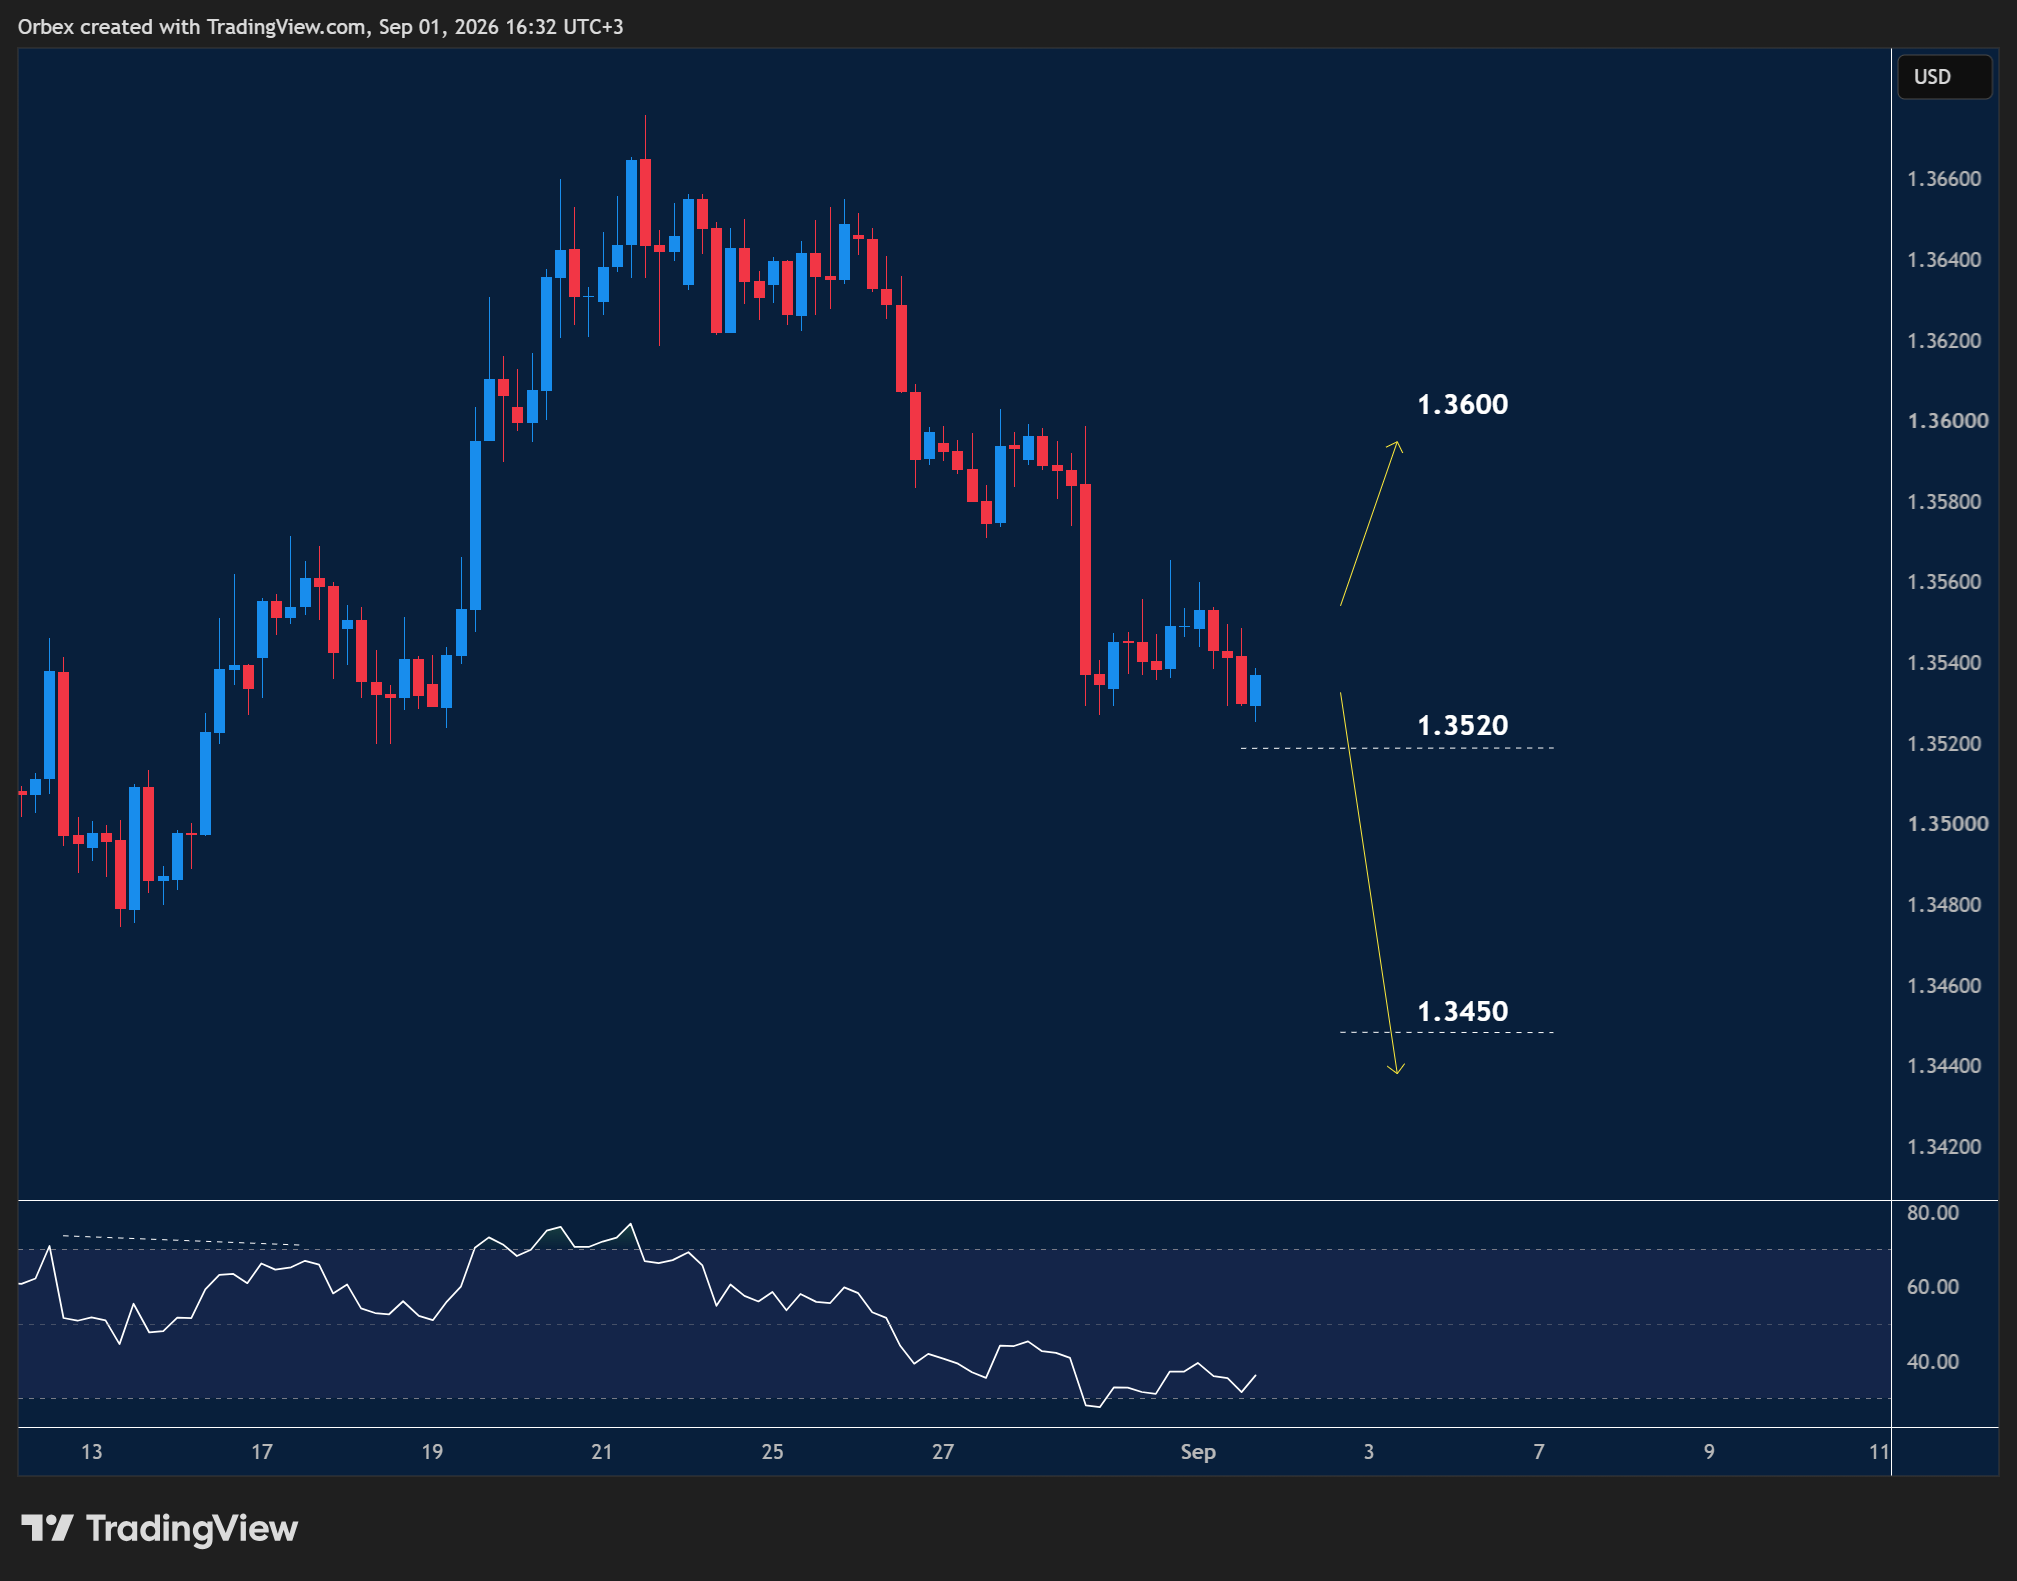
The pound attempts to bounce back after its choppy downturn over the past few weeks, finally finding some stability.
1.3520 is a critical support to prevent a dive below the 1.3500 level.
Medium-term sentiment remains upbeat, and bulls may view any pullback as an opportunity.
As a bullish divergence emerges on the RSI, 1.3600 is the next target.
A break at the said support could cause a continuation lower, with 1.3450 being the next zone.
SPX 500 loses momentum
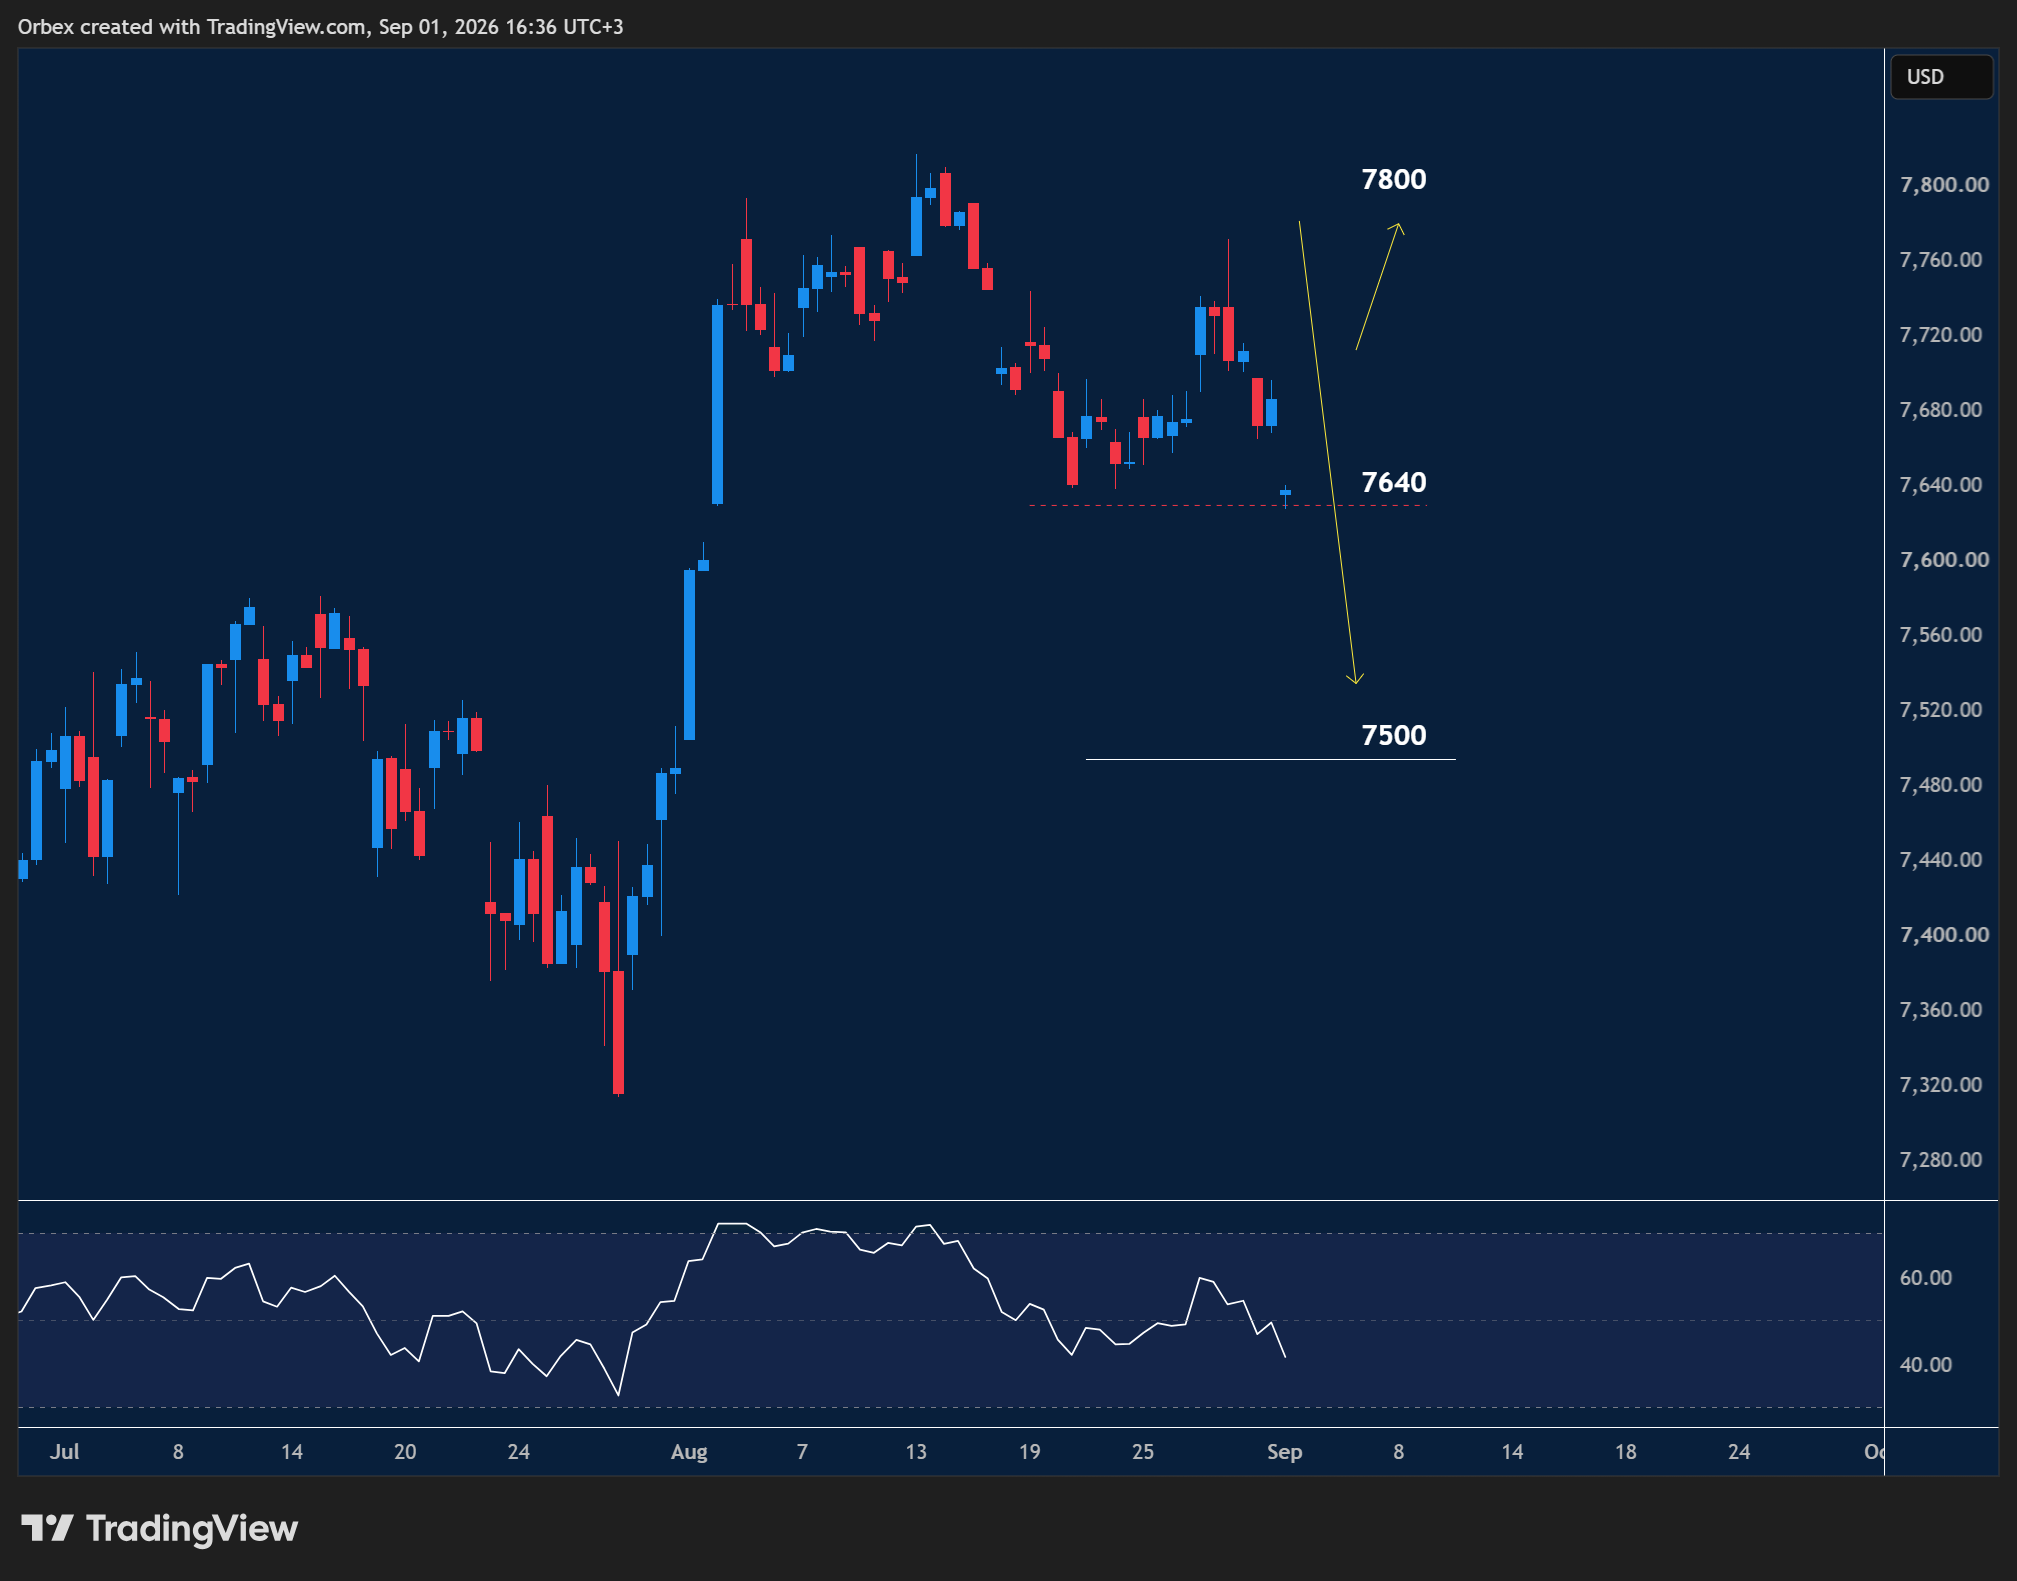
The S&P 500 falls away from another record as worries over energy prices drop global indices.
The rally accelerated after opening the session with a gap as the 7700 level was broken.
The index is on its way to 7500 if price action remains under the current support at 7640.
As the RSI moves towards the oversold zone, traders could look to buy the dips if a bullish divergence emerges.


Comments
Log in or sign up to join the conversation.