

Most of the discussion of the macro implications of an expanded Russian invasion of Ukraine presumes elevated oil prices (e.g., [1]). This makes sense, certainly for the short run. However, if oil prices rise sufficiently (keeping in mind for Brent have already risen from about $70/bbl to $90/bbl), they will kick the economy into a slowdown. Slowdowns tend to push down oil prices. I think in terms of graphs; this is how I see the short term, and (potentially) medium term.
Short term, in an AD-AS framework, a conflict raises uncertainty and risk, depressing domestic aggregate demand both at home and abroad. The AD curve shifts in (exports fall, and model assumes financial frictions so investment falls, dark gray arrow). Oil prices spike (light gray arrow), causing cost-push inflation. EX is exports, ρ is risk.

Figure 1: Rise in oil prices and decrease in rest-of-world output, and rise in risk.
Output falls to Y2 and prices rise to P2 – stagflation at least in period 2. Red arrows show the path of price level and output.
However, as output falls, presumably that feeds into world demand for oil. With low price elasticity of oil, it doesn’t take much to push oil prices back to where they started.
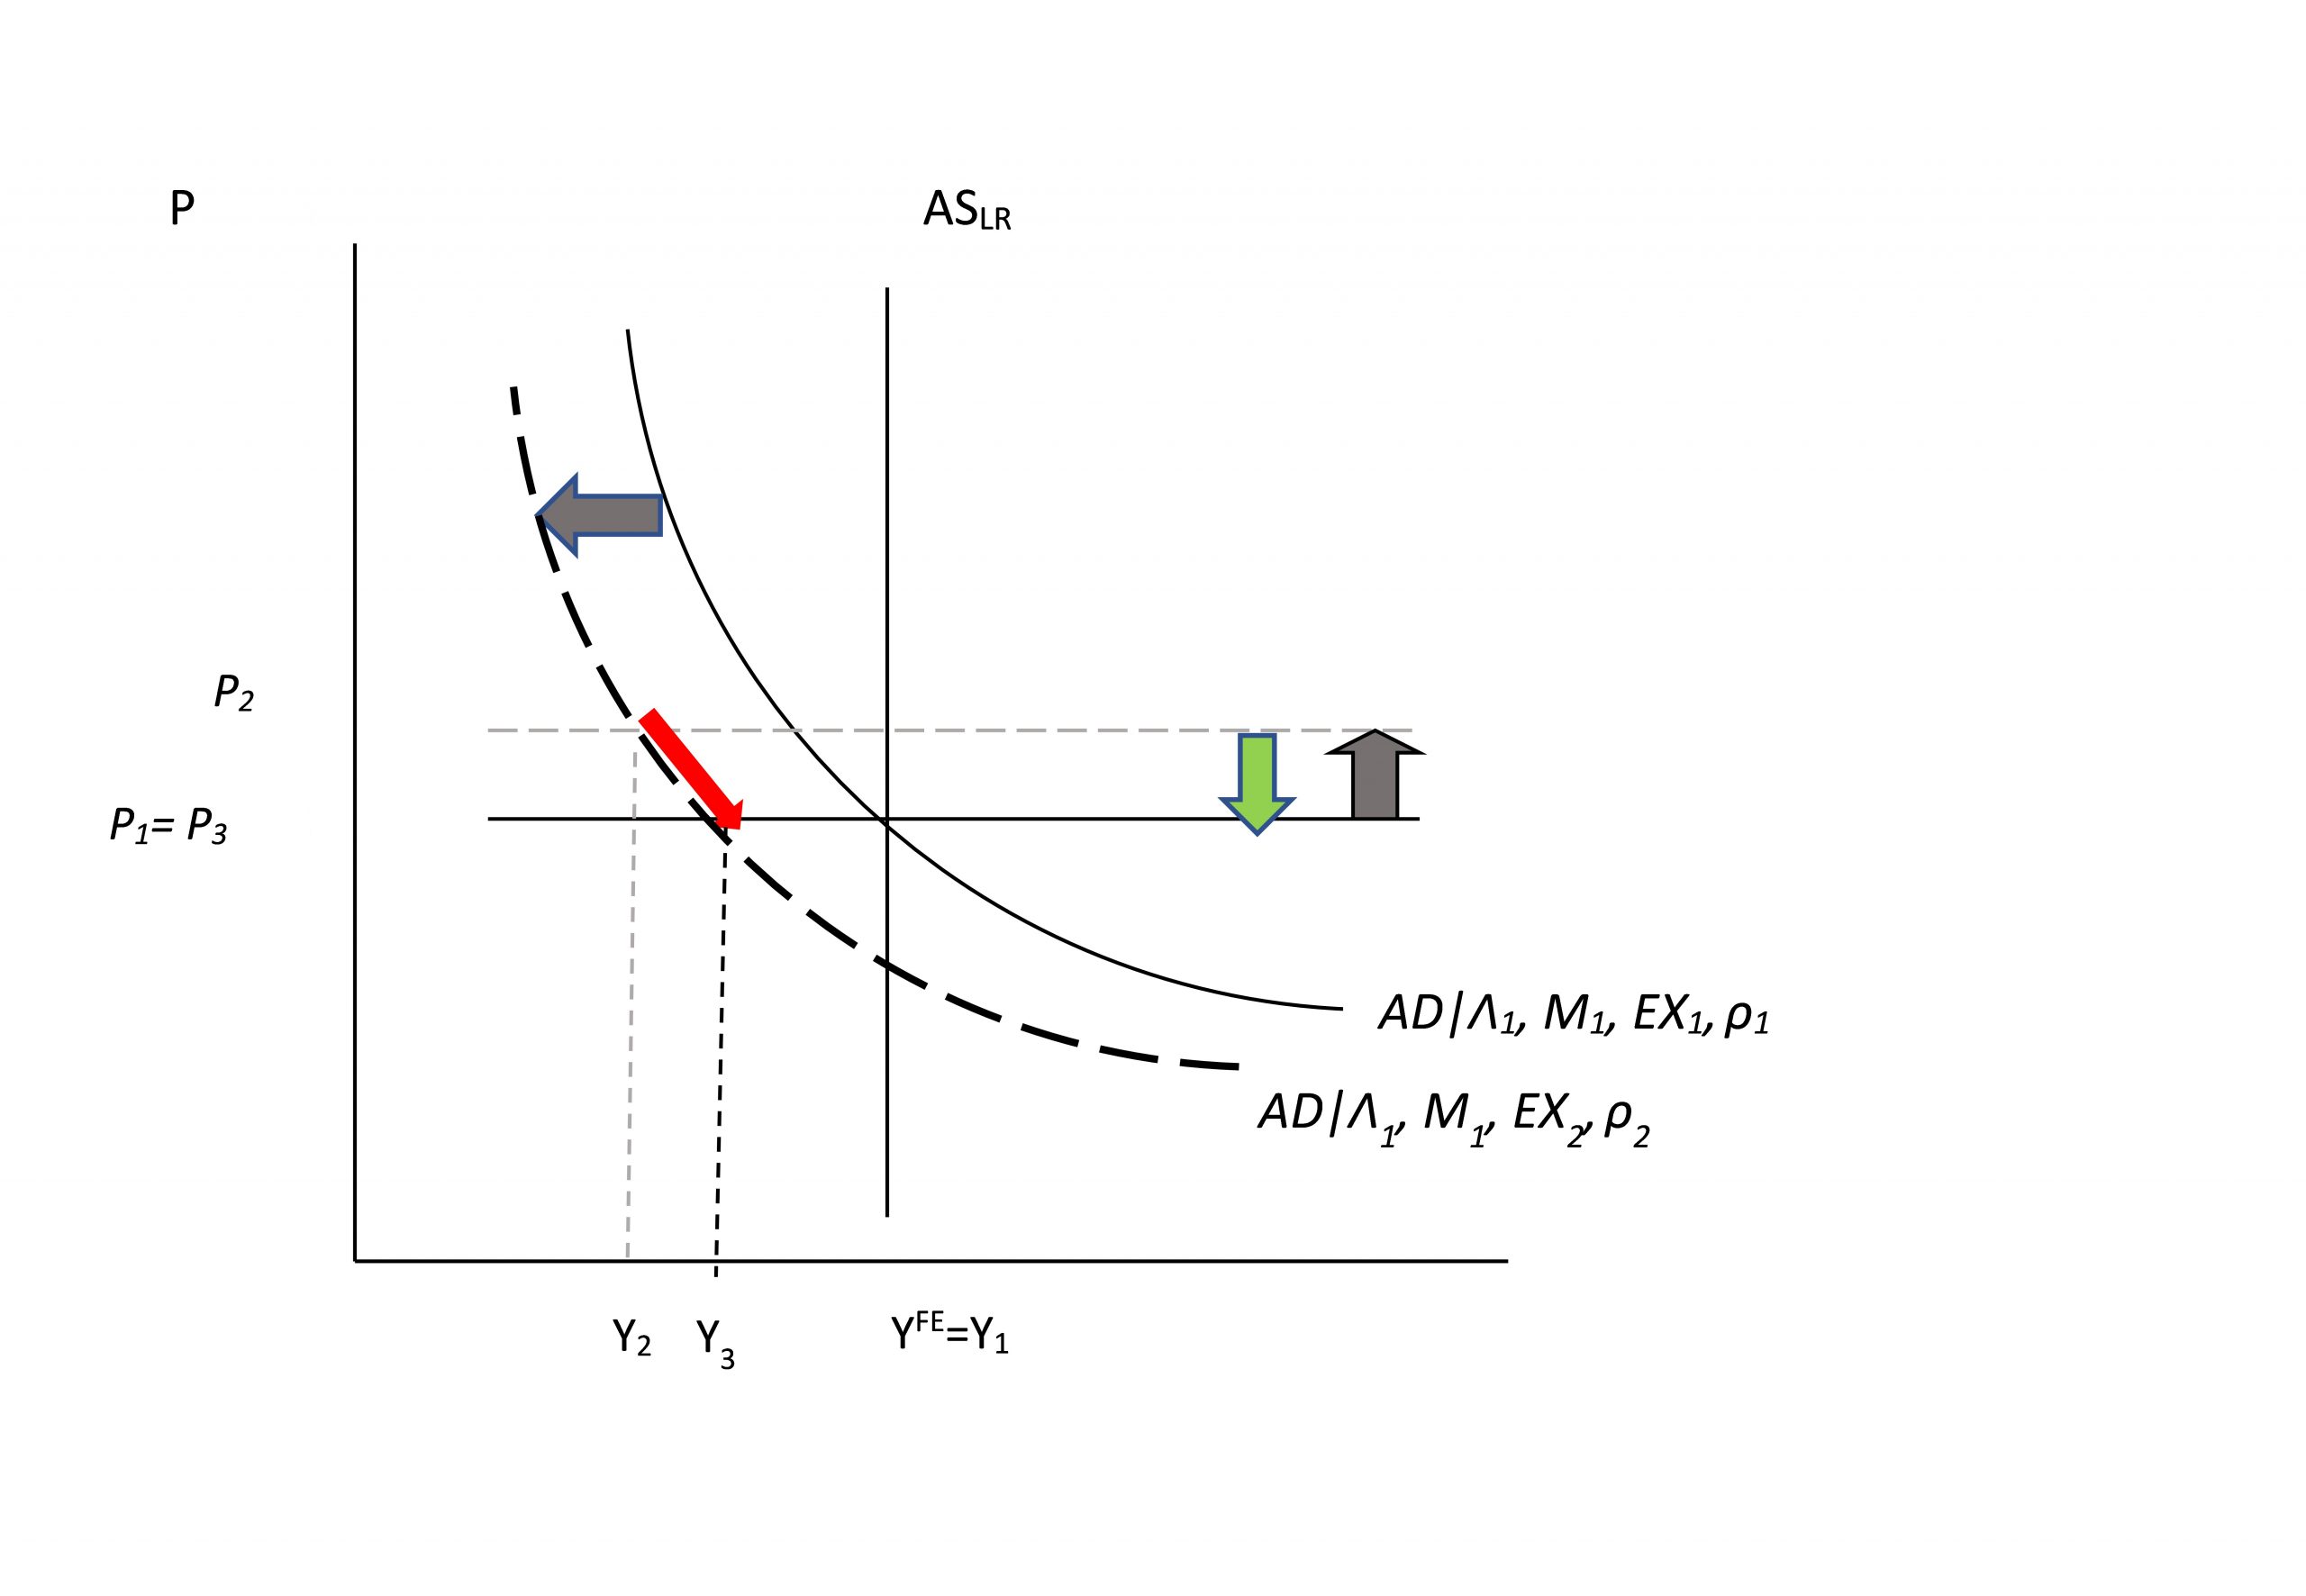
Figure 2: Fall in oil prices and rest-of-world output remains depressed, and risk elevated.
Output recovers somewhat to Y3, and price level falls to P3 (in the absence of stimulative fiscal and monetary policies).
Would oil prices fall as economic activity fell, and if so, how much? One can take a cue from the extraordinarily mild 2001 recession; by recession end (trough), oil prices fell 28% from recession start (peak).
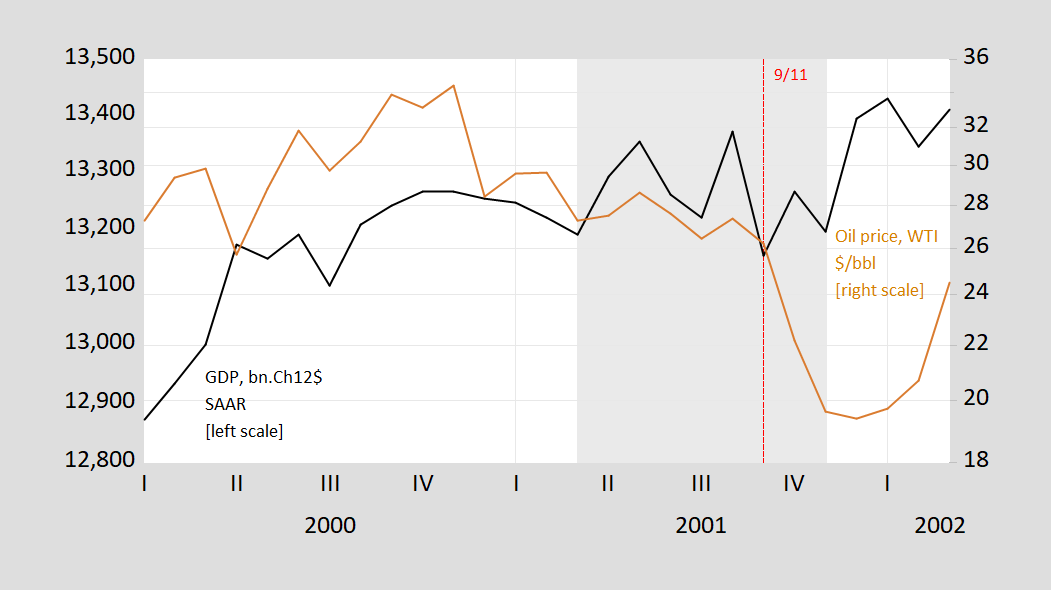
Figure 3: GDP, bn.Ch.2012$ SAAR (black, left log scale), and price of oil, WTI, $/bbl (brown, right log scale). NBER defined recession dates peak-to-trough shaded gray. Source: IHS-Markit, EIA via FRED, NBER.
The more likely a big oil price increase, the more likely a central bank response. While expected interest rates (as inferred from yield curve, and elsewhere) are rising, it’s hard to separate the motivations – higher inflation due to persistent cost-push pressures, or due to possibly higher oil prices coming from Russia’s threat to Ukraine.
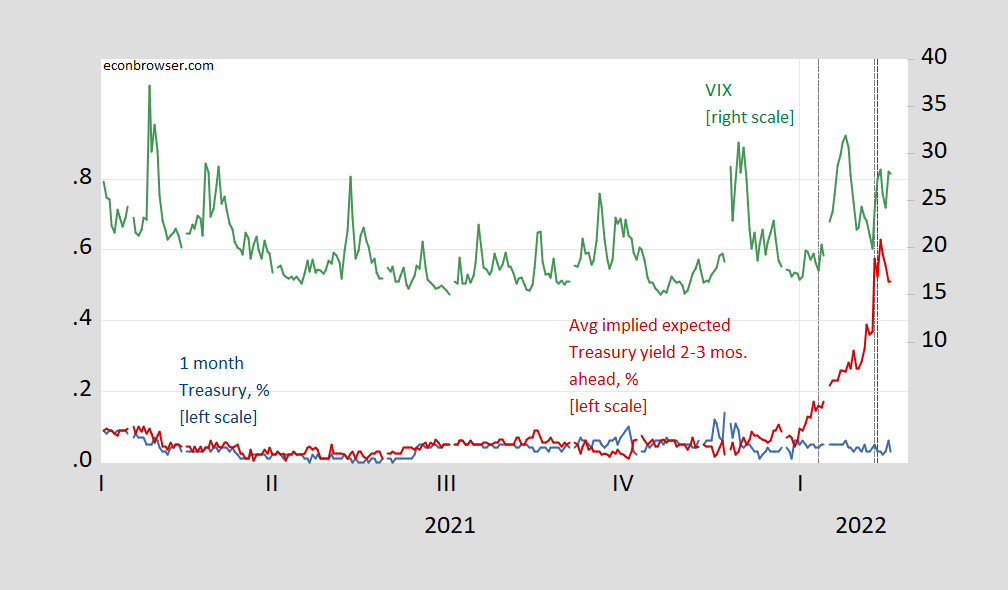
Figure 3: 1 month Treasury yield, % (blue, left scale), implied average Treasury yield in months 2-3, in % (red, left scale), VIX (green, right scale). Red dashed line at Sec. Blinken’s press conference on 2/11, gray dashed lines at 1/12 and 2/12 CPI releases. Source: Treasury via FRED, CBOE via FRED, and author’s calculations.
Blowback, in the form of lower oil prices, and implications for Russian GDP, is something Russian policymakers should consider.
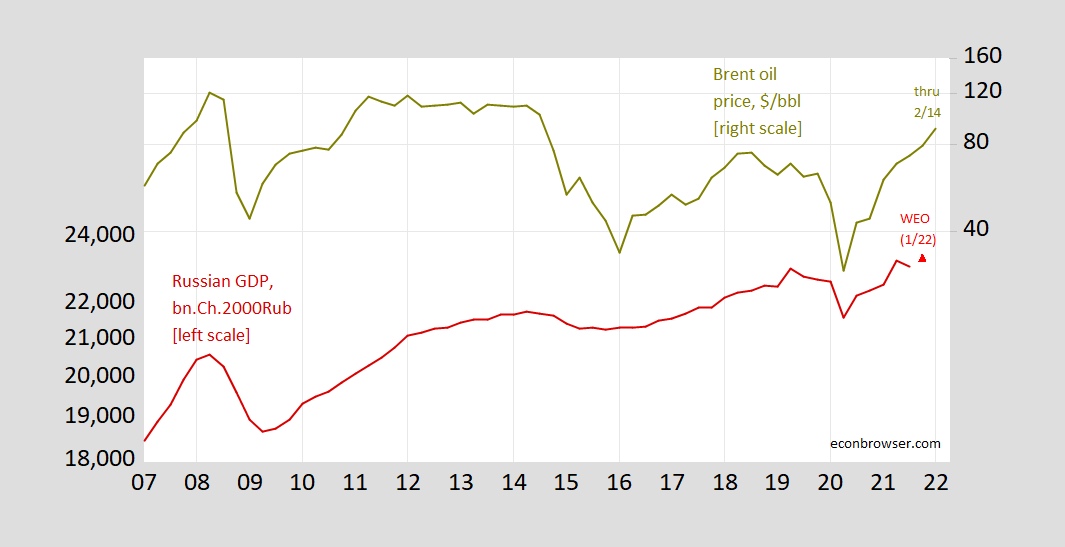
Figure 4: Russian GDP, in bn.Ch2000Rubles, seasonally adjusted (red, left log scale), IMF forecasted level for 2021Q4 (red triangle, left log scale), and oil price (Brent), $/bbl (chartreuse, right log scale). 2022Q1 is for first half of quarter. Source: OECD via FRED, IMF January WEO update, EIA via FRED, author’s calculations.


Comments
Log in or sign up to join the conversation.