We are five weeks into the decline phase of the intermediate-term cycle that began in March. The latest intermediate-term low may have formed during the week ending September 25, although we would need to see additional strength to confirm that development.
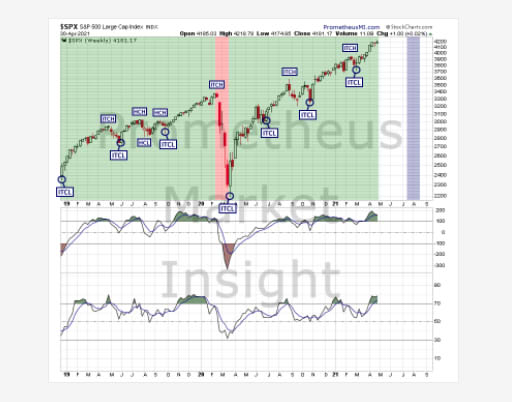
S&P 500 Index Weekly Chart Analyses
The magnitude of the previous decline phase signals the likely transition to a bearish intermediate-term trend and favors additional losses. The following technical and cycle analyses provide intermediate-term forecasts for the S&P 500 index.
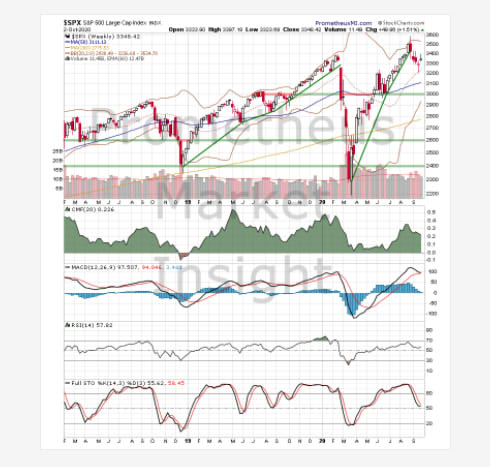
Technical Analysis
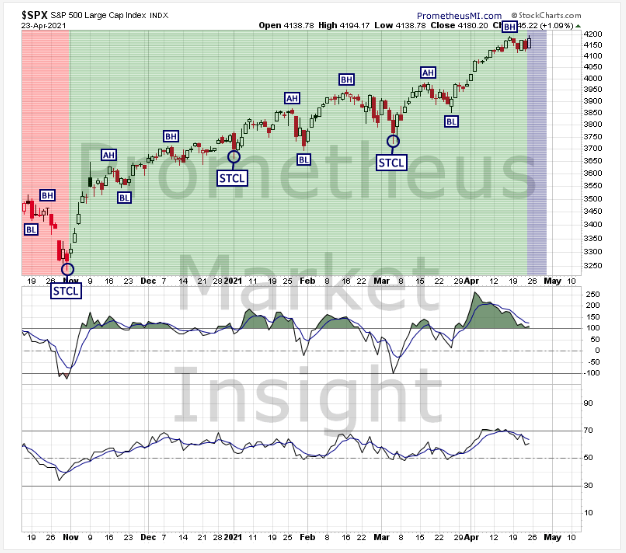
The index closed moderately higher this week, moving up toward previous highs of the uptrend from March. Technical indicators are moderately bullish overall, favoring a continuation of the advance.
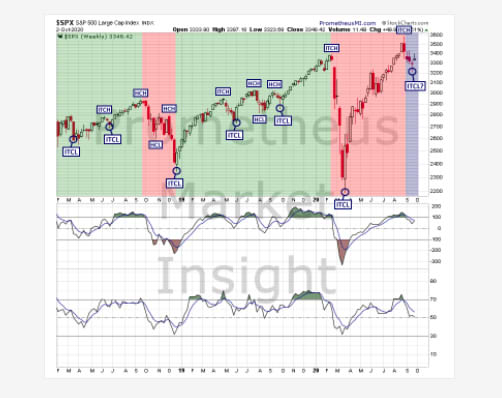
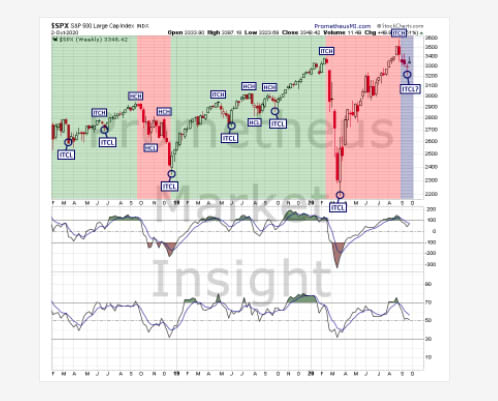
Cycle Analysis
We are five weeks into the decline phase of the cycle following the intermediate-term cycle low (ITCL) that occurred during the week ending March 27. The magnitude of the last decline phase signals the likely transition to a bearish translation and favors additional weakness. The window during which the next ITCL is likely to occur is now through October 9.
- Last ITCL: March 27, 2019.
- Cycle Duration: 28 weeks.
- Cycle Translation: Bearish.
- Next ITCL Window: Now through October 9.
- Setup Status: No active setups.
- Trigger Status: No pending triggers.
- Signal Status: No active signals.
- Stop Level: None active.
Intermediate-Term Outlook
- Bullish Scenario: A rebound and weekly close above the recent long-term high at 3,510 would reconfirm the uptrend from March and forecast additional gains.
- Bearish Scenario: A weekly close below the recent short-term low at 3,285 would predict a return to the middle of the Bollinger bands at 3,237.
Both scenarios are equally likely.
Comments
Log in or sign up to join the conversation.