
Stock Market Commentary
We are 18 weeks into the rally phase of the intermediate-term cycle that began in March.
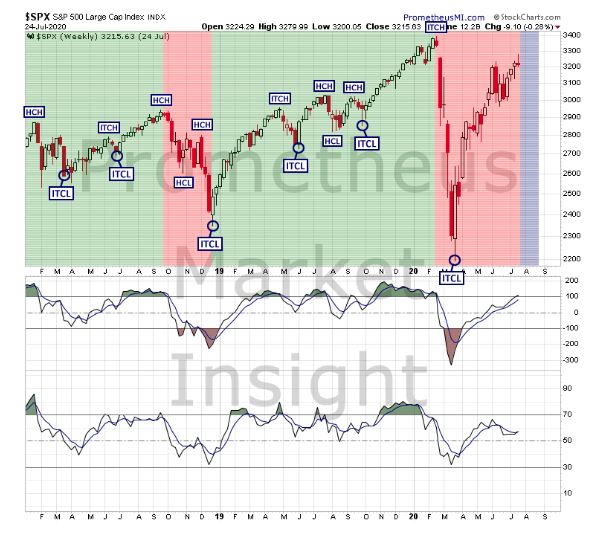
The magnitude of the last decline phase signals the likely transition to a bearish intermediate-term trend and favors additional losses during the next decline phase.
S&P 500 Index Weekly Chart Analyses
Technical Analysis
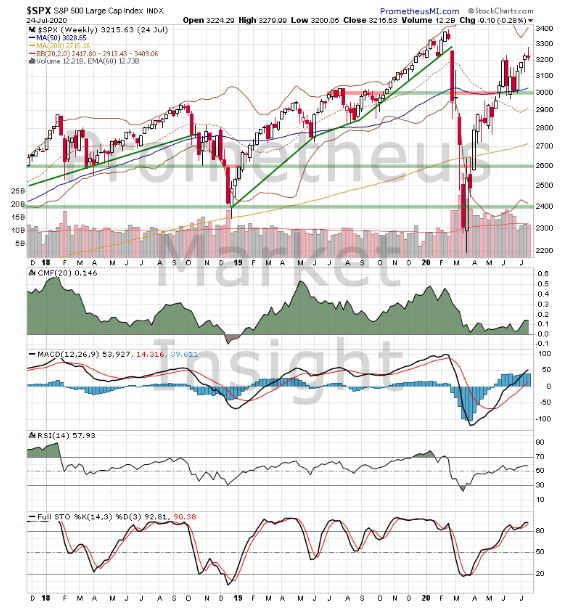
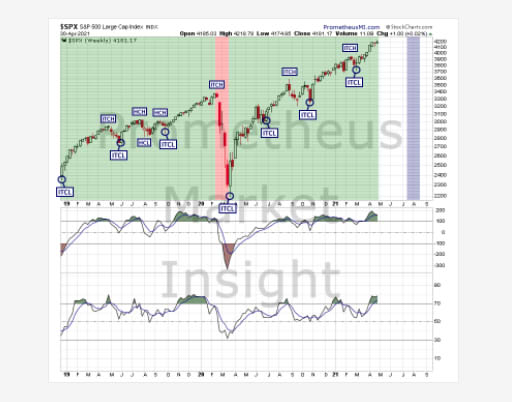
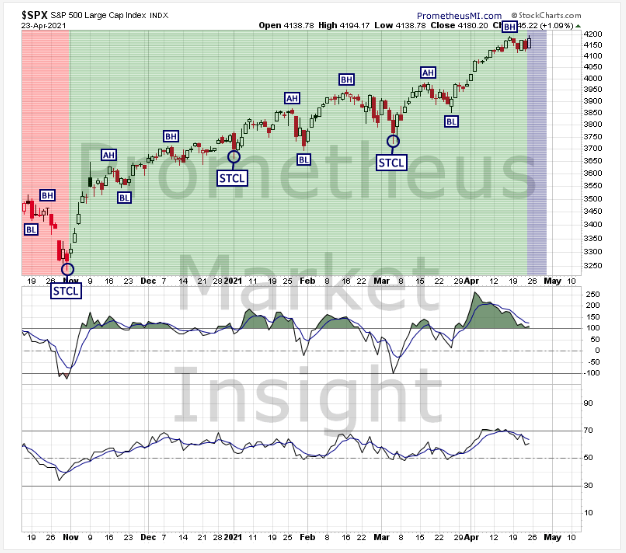
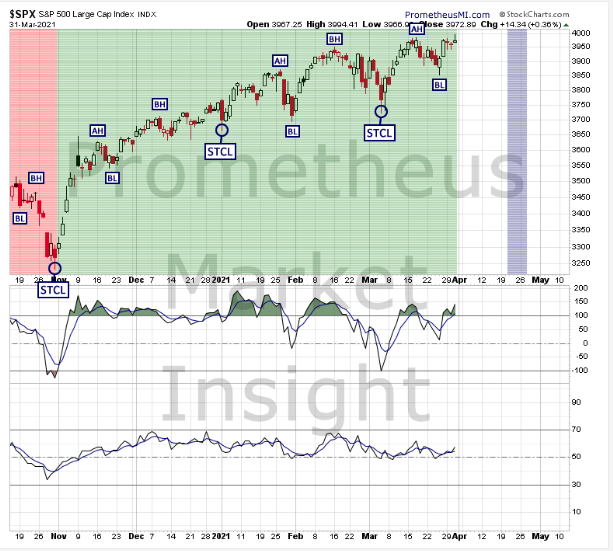
The index closed slightly lower this week, holding near recent highs of the uptrend from March. Technical indicators are moderately bullish overall, favoring a continuation of the advance.
Cycle Analysis
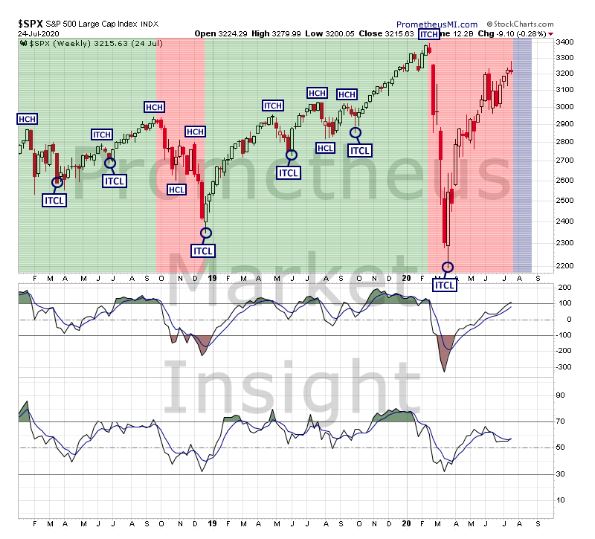
We are 18 weeks into the rally phase of the cycle following the intermediate-term cycle low (ITCL) that occurred during the week ending March 27. The magnitude of the last decline phase signals the likely transition to a bearish translation and favors additional weakness. The window during which the next ITCL is likely to occur is now through September 11, with our best estimate being in the August 7 to September 4 range.
- Last ITCL: March 27, 2019
- Cycle Duration: 18 weeks
- Cycle Translation: Bearish
- Next ITCL Window: Now through September 11; best estimate in the August 7 to September 4 range.
- Setup Status: No active setups.
- Trigger Status: No pending triggers.
- Signal Status: No active signals.
- Stop Level: None active.
Intermediate-term Outlook
- Bullish Scenario: A weekly close well above current levels would reconfirm the uptrend from March and forecast additional gains.
- Bearish Scenario: A reversal and weekly close below the middle of the Bollinger bands at 2,913 would predict a return to the 200-week moving average at 2,715.
The bullish scenario is slightly more likely (~60 probable).
Comments
Log in or sign up to join the conversation.