
Just when the S&P 500 Index really got rolling last week, making a new closing high on Monday and then a new intraday high on Tuesday, sentiment turned decidedly negative Wednesday after the Federal Reserve released the minutes of the December FOMC meeting suggesting they may rise interest rates faster than previously expected. By the end of the week, the yield on the 10-Year Treasury Note jumped up 24 basis points to end at 1.76%. Perhaps last week's rate advance reflects bond traders front running (selling) before this Wednesday's Consumer Price Index release. Interestingly, last March the yield reached 1.74% before turning lower. The Market Review adds details including a WTI crude oil update.
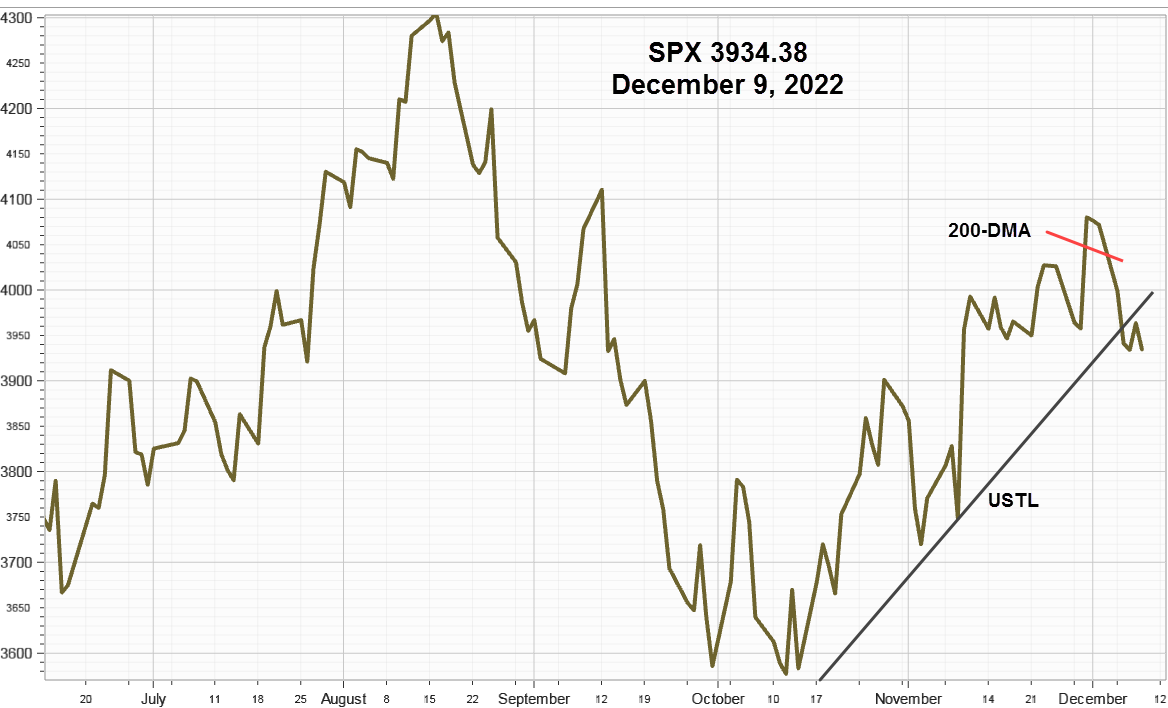
S&P 500 Index (SPX) 4677.03 dropped 89.15 points or -1.87% last week after declining 92.96 points or 1.94% last Wednesday after the release of the FOMC minutes. Now slightly above first support from the 50-day Moving average at 4674.51with the next test down where the upward sloping trendline crosses around 4600. Presuming the recent pullback pattern continues the trendline should support the decline.
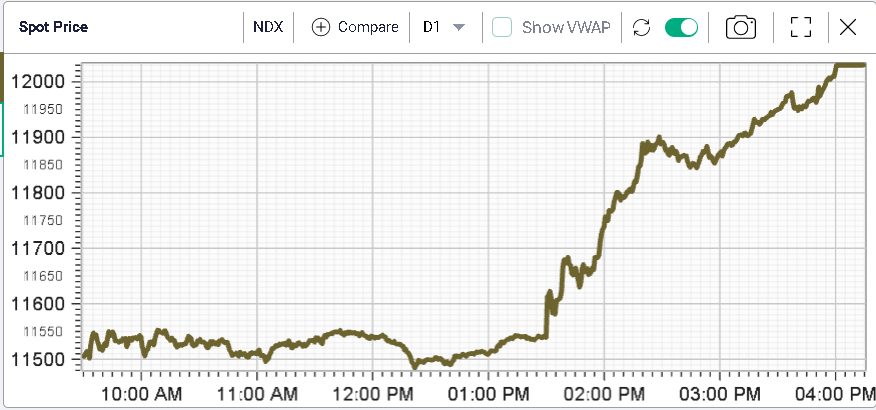
Invesco QQQ Trust (QQQ) 379.86 declined 17.99 points or -4.52% last week with most of the decline occurring on Wednesday as it crossed below, then closed below, the 50-day Moving Average now 393.19. With greater sensitivity to increasing interest rates, it declined more than twice as fast in percentage as SPX. From a technical perspective, it appears ominous with either a potential Head & Shoulders top or a double top activated on closes below 377.47.
CBOE Volatility Index® (VIX) added 1.54 points or +8.94% last week ending at 18.76 after reaching 21.06 Thursday. Our similar IVolatility Implied Volatility Index Mean, IVXM using four at-the-money options for each expiration period along with our proprietary technique that includes the delta and vega of each option, gained 2.43 points or +19.30% to end at 15.02% vs. 12.59 on December 31. Considering last Wednesday's SPX decline, options implied volatility gains seem muted.
(Click on image to enlarge)

VIX Futures Premium
VIX futures premium ended Friday at 13.90%, still in the green bull zone vs. 20.46 on December 31, with 7 trading days until the front month January futures expire on January 19.
(Click on image to enlarge)

The chart reflects the distance from the VIX to the futures curve computed from the two front month contracts. Since most of the volume and open interest are in the two closest futures contracts measuring the volume-weighted premium relative to the standard 30-day VIX provides a good real-time sentiment indicator based upon actual commitments of large Asset Managers and Leveraged Funds.
Market Breadth as measured by our preferred gauge, the NYSE ratio adjusted Summation Index that considers the number of issues traded, and reported by McClellan Financial Publications. After previously advancing 228.38 points the week before, last week it added another 121.10 points to end in positive territory at 19.74 despite losses by both SPX and QQQ. The 50-day Moving Average now at 70.90 does a good job defining the trend. Call it a positive divergence, one that should keep the bulls encouraged if it continues and the red line begins turning up.
(Click on image to enlarge)

WTI Crude Oil (CL) 78.90 basis February futures advanced 3.69 points or +4.91% last week closing well above the 50-day Moving Average at 74.76. As this seasonal chart for the last 5 February futures contracts from barchart.com shows, the short lived December decline occurred as anticipated, although it came early in the month.
(Click on image to enlarge)

A new operative upward sloping trendline will be established with new closing highs.
Of the many variables involved in crude oil pricing, inventory levels play a key role. The latest EIA report shows 417.9 million barrels as of December 31, 2021, compared to 420 million on December 24 and still below the 5-year Range creating tight market conditions; at this time last year, it was 485.5 million barrels.

Backwardation, when near month futures prices exceed deferred prices suggest tight market conditions. On Friday, February futures closed at 78.90 while February 23 futures ended at 71.46, backward by 7.44 or 9.43%. On December 10, January 22 compared to January 23 the backwardation was 4.06 or 5.64%, meaning an increase in demand for prompt delivery.
On December 4, the day of the last Disaggregated Commitments of Traders - Options and Futures Combined report (COT), cash closed at 76.99 up 1.01 points or +1.33% from the week before.
Positioning by the participants often produces signals at extremes, bullish or bearish and while currently most appear near the middle of ranges, both Commercials and Swaps combined had reduced their short positions by 12% since the middle of October suggesting less hedging.

Open interest is one way to measure trend momentum since it needs to keep expanding to sustain price moves in either direction. Currently, the divergence of price and open interest suggest trend weakness or a lack of hedging interest shown above.
Strategy
Increasing interest rates accelerated rotation out of stocks with high price-to-earnings (P/E) multiples and those without earnings valued on a price-to-sales basis.
Last week's 24 basis point gain in yield on the 10-Year Treasury Note may reflect selling the rumor before this Wednesday's Consumer Price Index release. If so, equities and rates may both stabilize.
For the S&P 500 Index watch to see if the 50-day Moving Average halts the decline. If not the next support should come at the trendline. Consider hedges should the trendline fail to support the decline thereby putting the medium-term trend in jeopardy.
Summary
After the first two days of the year, it seemed as if the bullish uptrend would continue, but the release of the FOMC minutes last Wednesday quickly turned sentiment negative and the S&P 500 Index declined to the first support zone around the 50-day Moving Average. Market breadth improved while futures and options indicators remained mostly positive. Yield on the 10-Year Treasury Note may stabilize after Wednesday's CPI report. Crude oil prices continued higher on lower inventory levels, but declining futures open interest suggest less enthusiasm.
Comments
Log in or sign up to join the conversation.