

Whilst we are waiting for Intel (INTC) to publish its quarterly results on 22 July, US newspaper the Wall Street Journal has published reports that the company, chaired by Pat Gelsinger, may be interested in acquiring GlobalFoundries for a value close to 30,000 million dollars.
GlobalFoundries is currently owned by Mubala Investment Co, of the Government of Abu Dhabi, although like Intel, it is headquartered in the Californian town of Santa Clara.
GlobalFoundries is dedicated to the manufacture of high-volume integrated circuits for semiconductor companies such as AMD, Broadcom or Qualcomm. Therefore, with this potential acquisition, Intel could deal a blow to its competitors and increase chip production in an environment where, due to the semiconductor crisis, demand is at record levels. Thus, with this potential acquisition Intel could experience a strong increase in its future results.
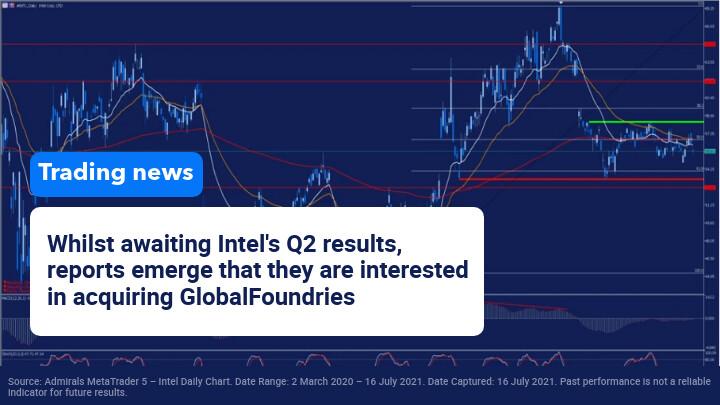
Technically speaking this company is being significantly impacted by the doubts surrounding inflation in the United States. After presenting its first quarter results in April, Intel has experienced a strong correction that has taken it back to levels not seen since January, forming a double floor in the red band near the Fibonacci retracement level of 61.8% after losing several support levels - thus, complying with the bearish divergence that we had been observing between the price and its MACD indicator.
Since that time, the price has moved in a wide lateral range between the red and green bands fighting to recover its 200-session moving average. We will have to pay close attention to next week's results, because if Intel manages to exceed market expectations, we could see a new upward momentum. Although as long as it does not overcome the upper resistance band (green), we cannot expect a long run.
(Click on image to enlarge)

Source: Admirals MetaTrader 5 – Intel Daily Chart. Date Range: 2 March 2020 – 16 July 2021. Date Captured: 16 July 2021. Past performance is not a reliable indicator for future results.
Evolution of the last 5 years:
- 2020: -16.76%
- 2019: 27.53%
- 2018: 1.67%
- 2017: 27.27%
- 2016: 5.28%



Comments
Log in or sign up to join the conversation.