

Today’s instrument is the Intel Corp.’s stock traded in the NASDAQ exchange under the ticker INTC.
When we look at the INTC’s chart, we can see it trading a downtrend as the overall market sentimentality continues to worsen. We can see the fall from the $54 level to $52.50 on January 22nd and then down to $50 on the 25th where it formed to support and led to the subsequent bounce back up to the $52 range combined with positive Q4 earnings results. It was last found trading at $51.61 with the closest overhead resistance of $53 and support at $50.
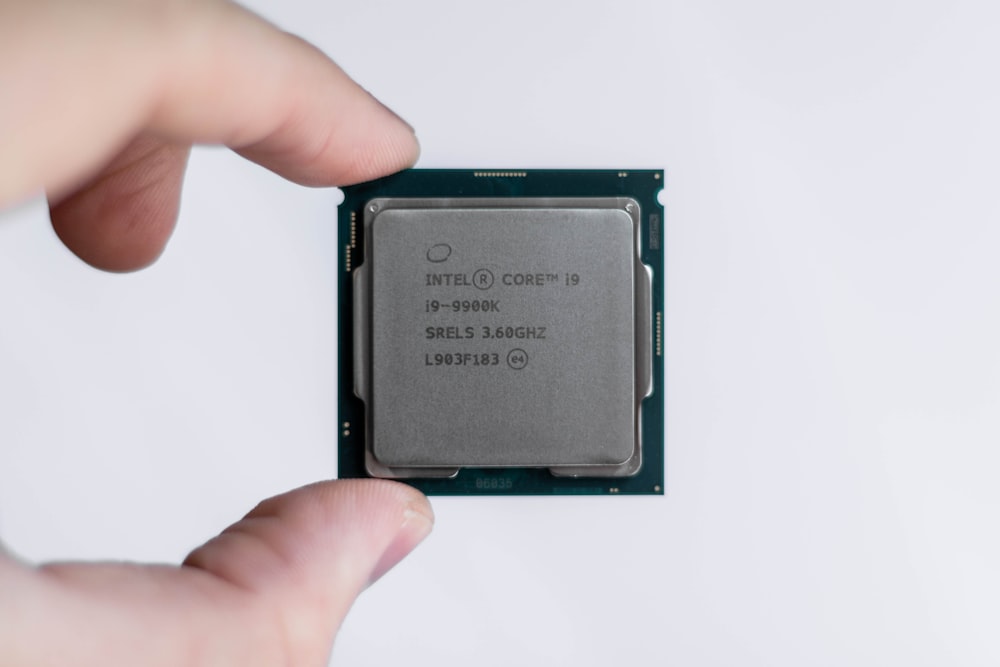
Photo by Christian Wiediger on Unsplash
Today we can expect a move towards the $53 resistance or consolidation at the current level.
If however, it doesn’t manage to hold on to the current level then a move towards and below the $50 can be expected.
(Click on image to enlarge)




Comments
Log in or sign up to join the conversation.