
Image Source: Unsplash
Intel Corp., Elliott Wave Technical Analysis
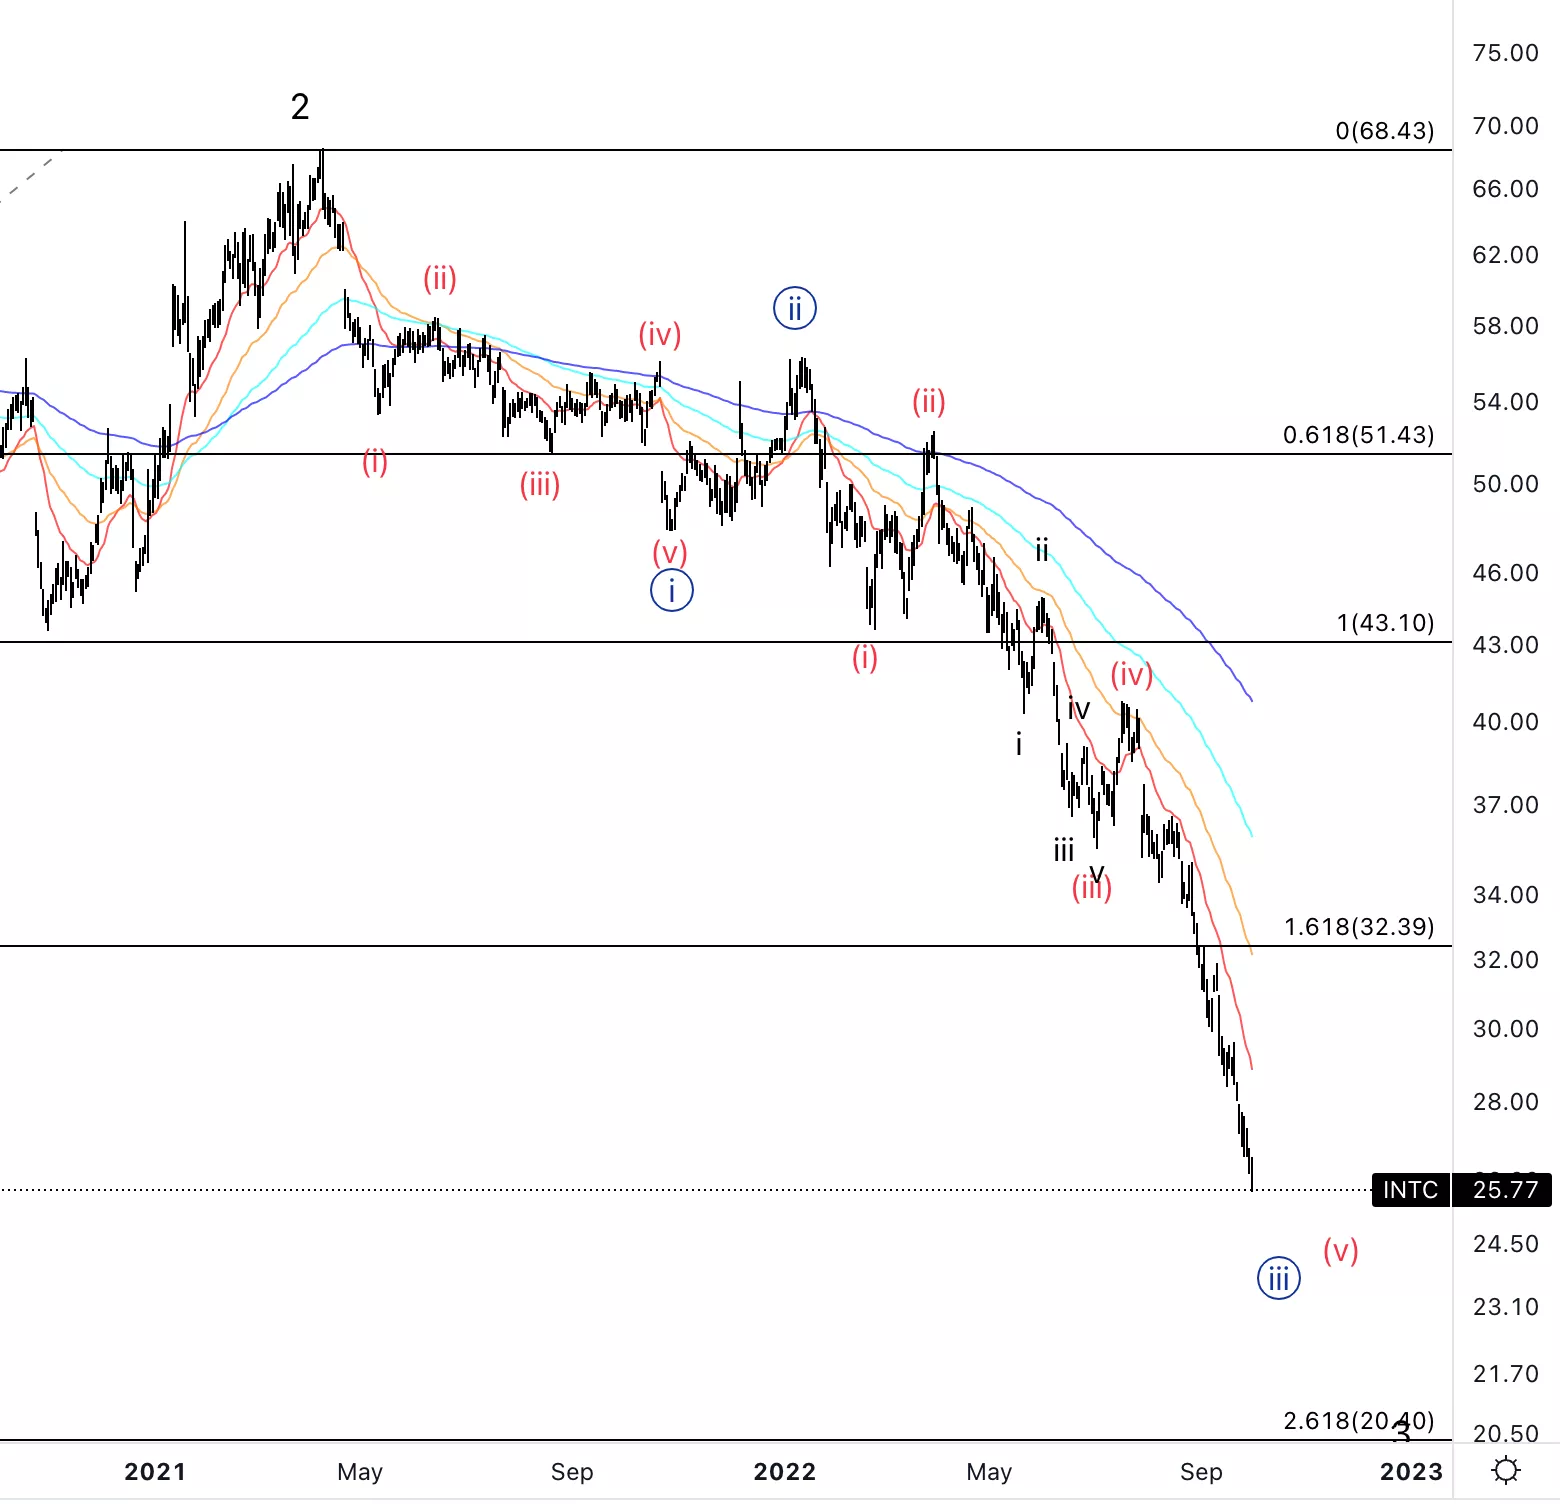
Intel Corp., (INTC:NASDAQ): Daily Chart, October 3 2022,
INTC Stock Market Analysis: We are in wave C part of a huge wave 2. I will be looking for shorts only.
INTC Elliott Wave count: (C) of {2}.
INTC Technical Indicators:All indicators are signaling bearish momentum.
INTC Trading Strategy: Looking to short any three wave upside pullback.
TradingLounge Analyst: Alessio Barretta
Source Tradinglounge.com
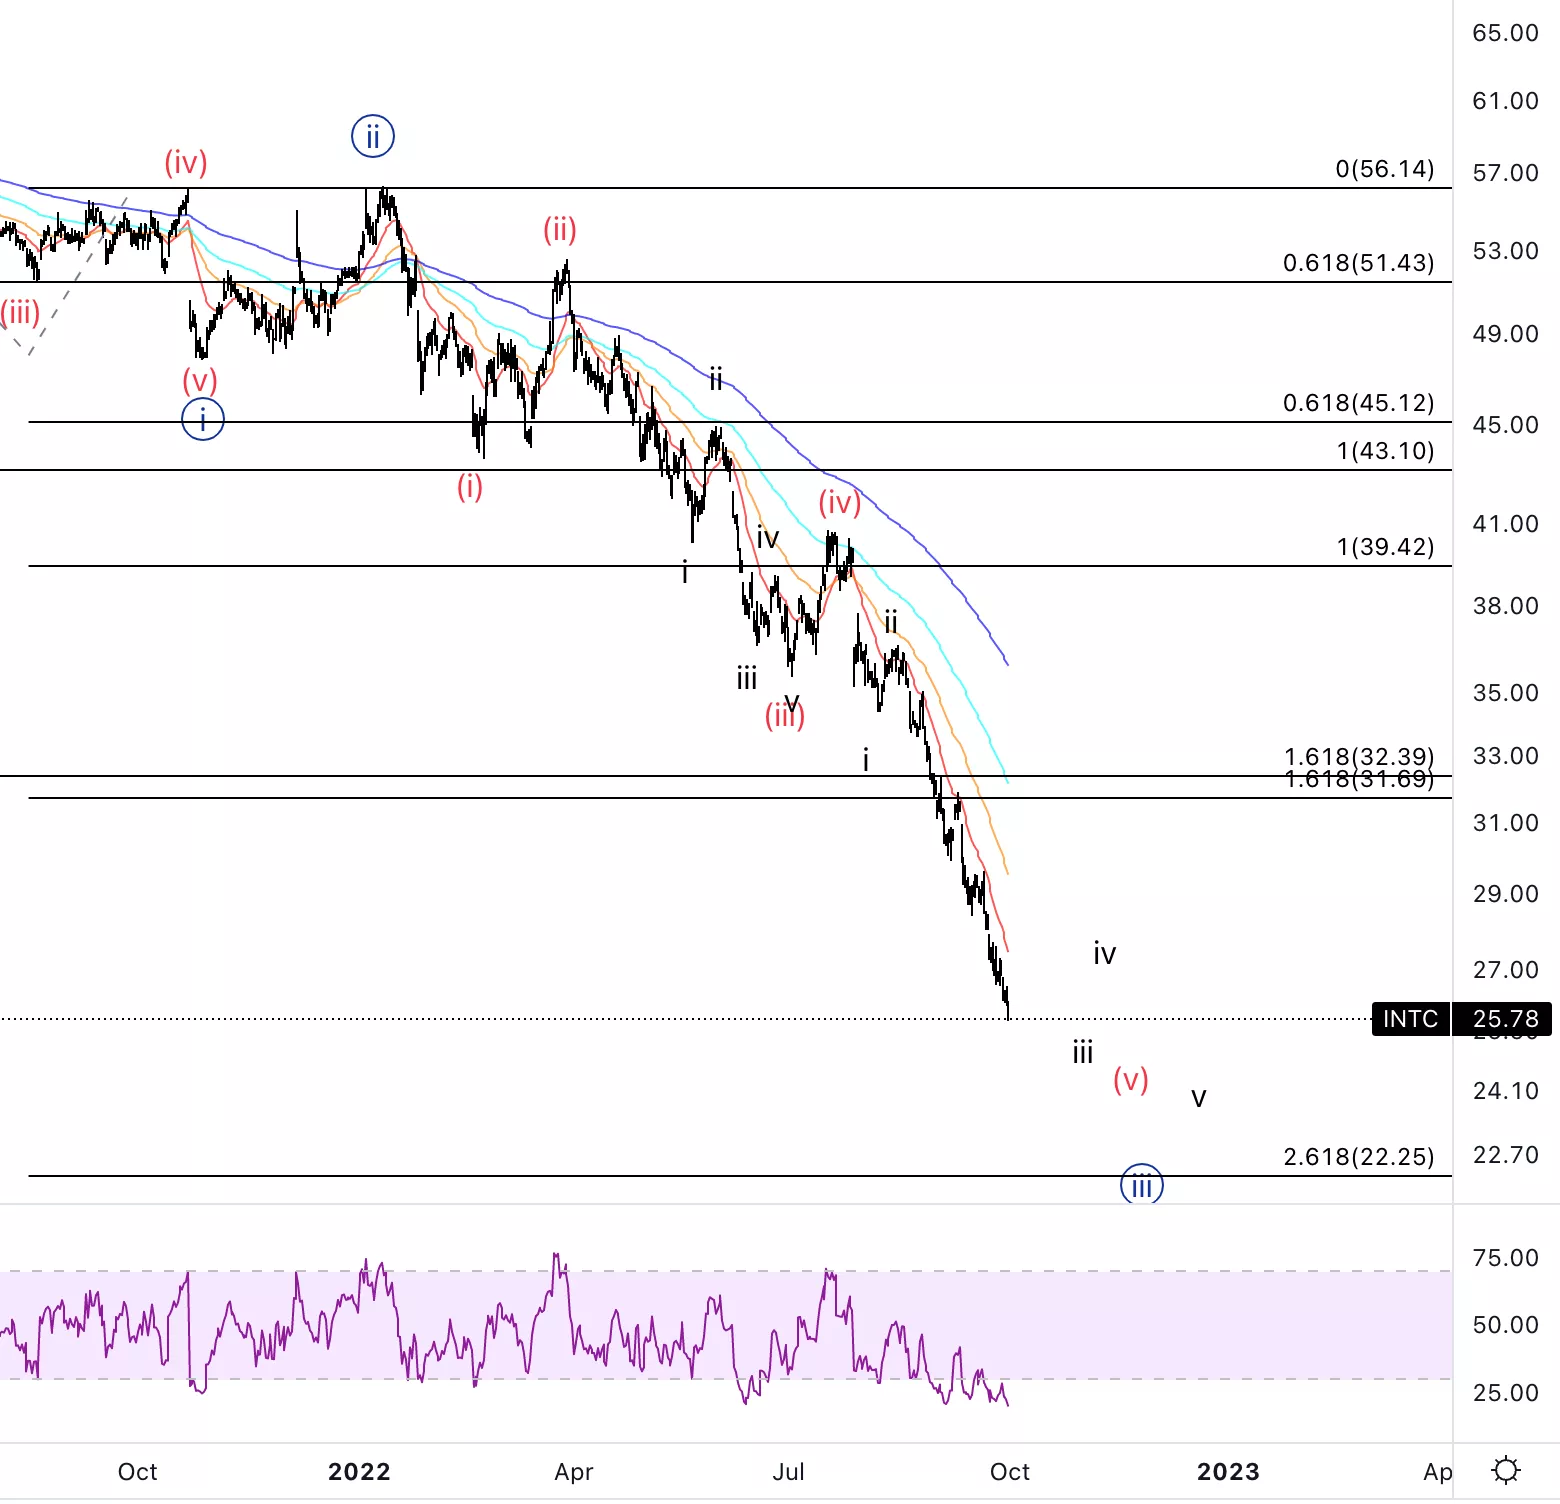
Intel Corp., INTC: 4-hour Chart, October 3 2022
Intel Corp., Elliott Wave Technical Analysis
INTC Stock Market Analysis: A textbook acceleration within a nest of waves threes. Looking formuch more downside to come.
INTC Elliott Wave count: iii of (v).
INTC Technical Indicators:All indicator are bearish, however we are starting to form RSI divergence which could indicate we are preparing for a slightly larger pullback.
INTC Trading Strategy: Looking to short any three wave upside pullback.
More By This Author:
Elliot Wave Commodity Markets: Gold Silver Forex Uranium Lithium Nickel Crude Oil Copper Natural Gas
Elliott Wave Technical Analysis: Binance, Oct. 3
US Stock Bear Market Elliott Wave Technical Analysis


Comments
Log in or sign up to join the conversation.