
“We wanted flying cars, instead we got 140 characters.” – Peter Thiel
Think about recent innovations that have changed the way you live:
- With a click or two on your smart phone a sedan appears to take you to your destination.
- Yesterday, you could film a video of your daughter riding a horse and instantly share it with 500 of your closest friends. Today, you can stream the same video live to anyone with a smart phone.
- Wear a wristband that tracks your exercise activity, weight and even sleep cycles.
- Pay your credit card and mortgage while lounging by the pool.
- Find a boyfriend or girlfriend meeting all of your desires without cheesy pickup lines.
- And of course, most importantly, shop anytime, at any major store, from anywhere.
These and many other new innovations save us a lot of time and effort but, believe it or not, they do little to generate sustainable economic growth. Sustainable economic growth is dependent upon productivity and despite these new innovations, domestic productivity is flat lining. In 2014, the annual growth rate of economic productivity in America ground to a halt at 0.10%. Sadly, our negligible productivity growth (total factor productivity, TFP) compares favorably to Europe (-0.44%), China (-0.10%), Japan (-1.20%), the United Kingdom (-.10%) and most other developed economies. Not surprisingly, global productivity, weighted by Gross Domestic Product (GDP), declined in 2014. Despite all of the wonderful innovations that make our lives easier, productivity growth has trended lower since the 1970’s, except for a few years around the tech boom of the late 1990s. Economic growth (GDP) in America and much of the rest of the world since the 1970’s has trended lower as well. In “The Humility of Rates and the Arrogance of Equities” we illustrate that secular GDP currently resides at the troughs of prior recessions, despite the long, slow recovery from the financial crisis of 2008.
With zero productivity growth, GDP simply becomes a measure of labor and capital deployment. Labor and capital are limited resources, therefore productivity, or our ability to leverage labor and capital, is the one factor that can produce sustainable economic growth over the long run. The confluence of sub-trend economic growth and declining productivity growth is neither a coincidence nor is it getting the attention it deserves. America and other leading world economies are consuming the limited resources of capital and labor predominantly for unproductive uses.
In our article “Corporate Buybacks; Connecting Dots to the F-word” we suggest that leadership in corporate America is shirking its responsibility to shareholders. Through the extensive and growing use of share buybacks, today’s corporate executives opt for actions producing “hollow short-term stock price gains” and the generous compensation which accompanies such actions. This self-serving use of corporate cash, often borrowed under the guise of expressing confidence in the company’s future prospects, is undertaken at the expense of longer-term strategic planning and expenditures aimed at growth-enhancing innovation. Share buybacks, however, are merely exemplary of a bigger problem – that of corporations focusing on maximizing today’s earnings instead of tomorrow’s growth. Corporate profit margins as shown below are just one of many clues that corporate management has changed its modus operandi. The first graph below shows the upward trend in corporate margins since 1990. The second graph shows the relationship of wages to profits (inverted – red line) to GDP. The declining trend in wages relative to profits explains a good portion of expanding corporate profit margins.
Corporate Profit Margins as a % of GDP
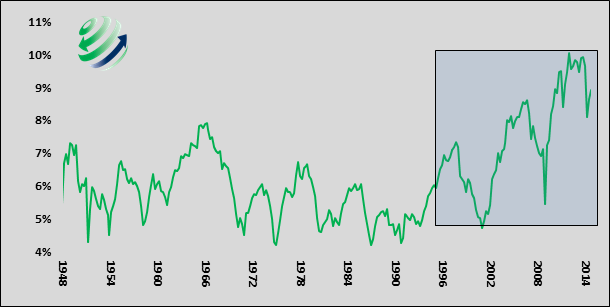
Data Courtesy: St. Louis Federal Reserve (FRED)
Ratio of Wages to Profits Versus GDP
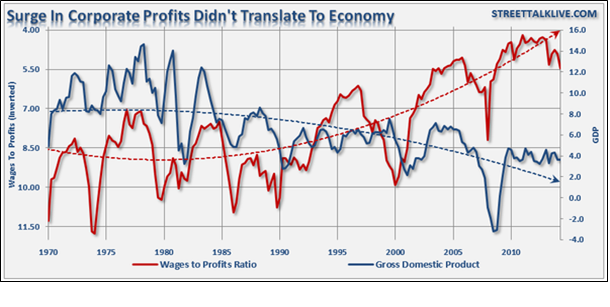
Chart courtesy: Lance Roberts streettalkalive.com
Corporate profit margins, which currently reside near 65 year highs, lead us to conclude that companies are expanding significant efforts toward running their companies as efficiently as possible. This is a good thing and should be applauded by shareholders. However, before clapping, it is incumbent upon investors to ask if executives are neglecting future growth to run more efficiently today, and, if so, what is the opportunity cost of this sacrifice?
The best way to assess whether future growth is being neglected is to observe productivity data such as in the graph below. The 10-year average productivity growth rate (black line) has declined significantly from the levels prior to 1980. Similarly, note the widening gap between the pre-1980 trend (black dotted line) and the more recent trend of the past 30+ years (red line). We believe companies are indeed sacrificing “market-creating or empowering innovations” to become more efficient, as supported by slowing national productivity gains. Companies are taking the excess earnings and increased free cash flow, resulting from efficiency gains, and either returning it to shareholders or plowing it back into more “efficiency innovations” and other expense minimization efforts. The intended effect is to rapidly improve financial ratios, metrics used to gauge a company’s performance, which by no coincidence are also used to justify equity prices and thus, often, executive compensation.
Total Factor Productivity (TFP) Trends
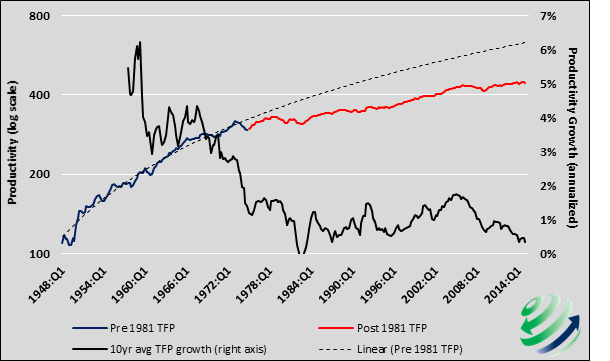
Data Courtesy: The Conference Board
The bolded terms in the passage above describe distinctions of innovations that were coined by Clayton Christensen, professor of Business and Administration at the Harvard Business School, best-selling author and co-founder of Clayton Christensen Institute for Disruptive Innovation. Christensen has long been at the forefront of the study of innovation and productivity.
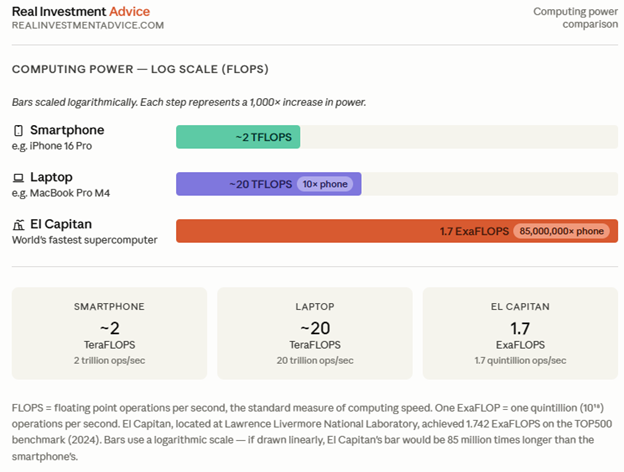
Christensen uses the computer as a great example of a “market-creating or empowering innovation”. Over the past 50+ years computers progressed from the behemoth ENIAC, which weighed over 30 metric tons, to the desktop/laptop PC and most recently to pocket-able smart phones. Over this period the number of users increased sharply as costs decreased significantly. Inventing and producing market-creating innovations, like the computer, have a long time horizon and typically involve significant dollar and labor investment. The risks of failure are plentiful. However, despite the longer time frame, costs and many risks, the dividends resulting from such innovations are long lasting and result in new products, jobs, and company and industry creation. Needless to say durable economic growth for years to come is another benefit.
“Efficiency innovations” produce benefits as well but they do not multiply upon themselves as do market-creating innovations. Innovations in this group decrease the costs of producing or distributing goods, typically by reducing the man hours or resources needed to manufacture or sell such goods. Self-checkout registers at supermarkets are a good example. These registers do not increase sales, however, they decrease expenses as fewer employees are required for the same amount of goods sold. The benefits of using automated registers are predominately cost savers and do not create incremental efficiencies. They are one hit wonders.
Efficiency innovations sustain economic growth by producing efficiencies and reducing costs while market-creating innovations produce incremental economic growth through the development of new products or services that subsequently proliferate. When both types of innovations are equally pursued an economy has the best chance to reach its optimal growth rate. Efficiency innovations reduce the need for labor and other resources resulting in higher profit margins and ultimately additional profits to corporations. The additional cash flow and excess labor capacity can then be employed to develop market-creating innovations. When market-creating innovations come to fruition, they create new jobs, businesses and more efficiency innovations. This virtuous and reinforcing innovation cycle is essential to building sustainable economic growth.
Today this cycle is clearly out of balance as exposed by increased profit margins and stagnating productivity data. Additional profits resulting from efficiency gains are chasing more efficiency innovations instead of market-creating innovations like the next computer, Model T, steam engine, or telephone. Jobs are being lost due to the gained efficiencies but new ones are not readily being created. As a result economic growth is stagnating.
In an interview with Forbes in 2012 Christensen had this to say about efficiency innovations: “Our current economy, however, has gone off of the rails in large part because we are focused almost entirely on efficiency innovations—on streamlining and wringing bottom line savings and additional profits out of our existing organizations.”
A year later he followed it up with this from an interview in Inc. magazine: "My sense is over the last 20 years the American economy has generated about one-third the number of empowering innovations as was historically the case," he said. What's the potential toll of all this lost innovation on the future of the country? Christensen hypothesized: "If you want to know what the future of America looks like, just look at Japan. You can feel the same thing happen in the United States, and I worry a lot about that."
We mentioned earlier that GDP coupled with zero productivity growth is simply a measure of labor and capital deployment. Productivity is the leverage that allows us to get more out of capital and labor. In the short run, efficiency innovations accomplish this however in the longer run efficiency innovations can have a stagnating effect on economic growth absent the development of market-creating innovation. The chart below shows how the contribution of the 3 factors of economic growth (productivity, capital and labor) have changed over time in the U.S. This highlights our concern that we are not using our finite capital and labor resources as productively as we should. How much longer can we rely on the benefits of the baby boom demographic and debt growth to account for a large and growing portion of economic growth?
Contributions to Economic Growth
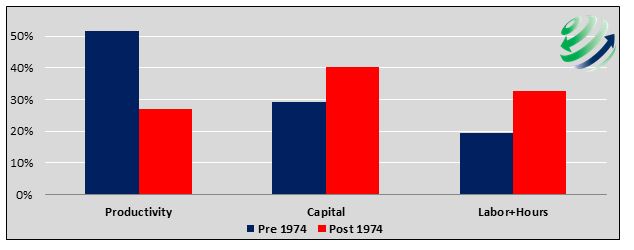
Data Courtesy: The Conference Board
As the data and Christensen make clear we are reaching the limits of economic growth barring new market-creating innovations. Recent U.S. demographic changes, characterized by aging baby boomers reaching retirement age, and tougher immigration policies, are stunting work force growth. The current U.S. employment participation rate is at a 38-year low (equaling the 62.6% in October 1977). The demographic tailwind is quickly becoming a headwind as the burden of supporting a growing elderly population will become heavier. Facing this headwind we also must contend with the increasing challenges brought on by record high debt levels restricting our capacity to afford more capital. The Ratio of total debt to GDP stands at 343%, the highest level in well over 100 years.
As a result, economic growth is becoming increasingly dependent on productivity gains as labor and capital growth become harder to achieve. Within the last month, the IMF, World Bank and Goldman Sachs downgraded their long term economic growth projections for the United States. We suspect this was largely done in response to dismal productivity data recently released by the U.S. Conference Board for the years 2013 and 2014.
Investors
As investors we need to clearly understand these trends and the potential implications. Proper valuation of a company involves the estimation of earnings and cash flows for a long period of time. Most equity analysts form a base line of current or near term earnings expectations and then compound the earnings at a pre-determined and assumed growth rate(s). These growth expectations are typically tied to corporate, industry and overall economic projected growth rates. Slight variations in expected growth rates can have an outsized effect. This sensitivity to assumed growth rates is further magnified today by price-to-earnings ratios and other valuation measures that are at or near all-time highs. In the chart below we show how a small 2% change in future earnings growth results in a 25-30% reduction in the present value of that expected earnings stream. Needless to say the combination of a normalization of valuations with a decrease in expected future earnings would be devastating for stock prices.
Present Value Sensitivity to Different Growth Rate Assumptions
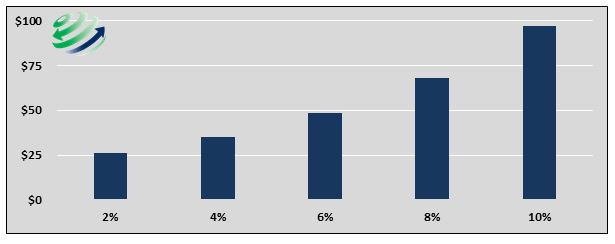
Based on $1 of present earnings compounded using various growth rates as shown for 30 years
Change
America is an innovative society but we are putting too much emphasis on efficiency innovations and not enough on market changing innovations. This imbalance is costing us dearly. The mindsets of investors, corporate America and society as a whole needs to change. Focus needs to be redirected from the present to the future. For example:
- Executive compensation structures need to reflect the long term performance of companies
- The U.S. government should thoughtfully ponder tax reforms that reward companies investing in market changing innovations
- The Federal Reserve should acknowledge and re-consider the consequences of extreme monetary policy measures
- Investors should demand CEOs’ earn their exorbitant compensation by implementing thoughtful long term investment strategies.
Comments
Log in or sign up to join the conversation.