

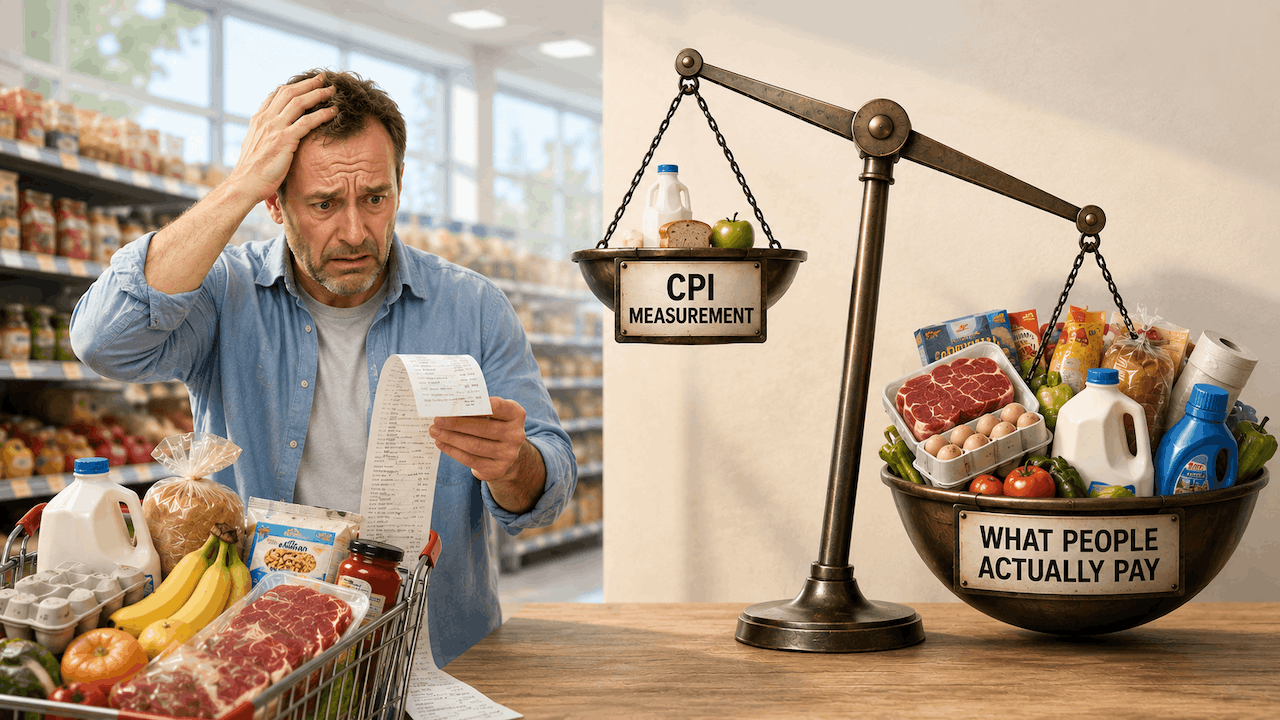
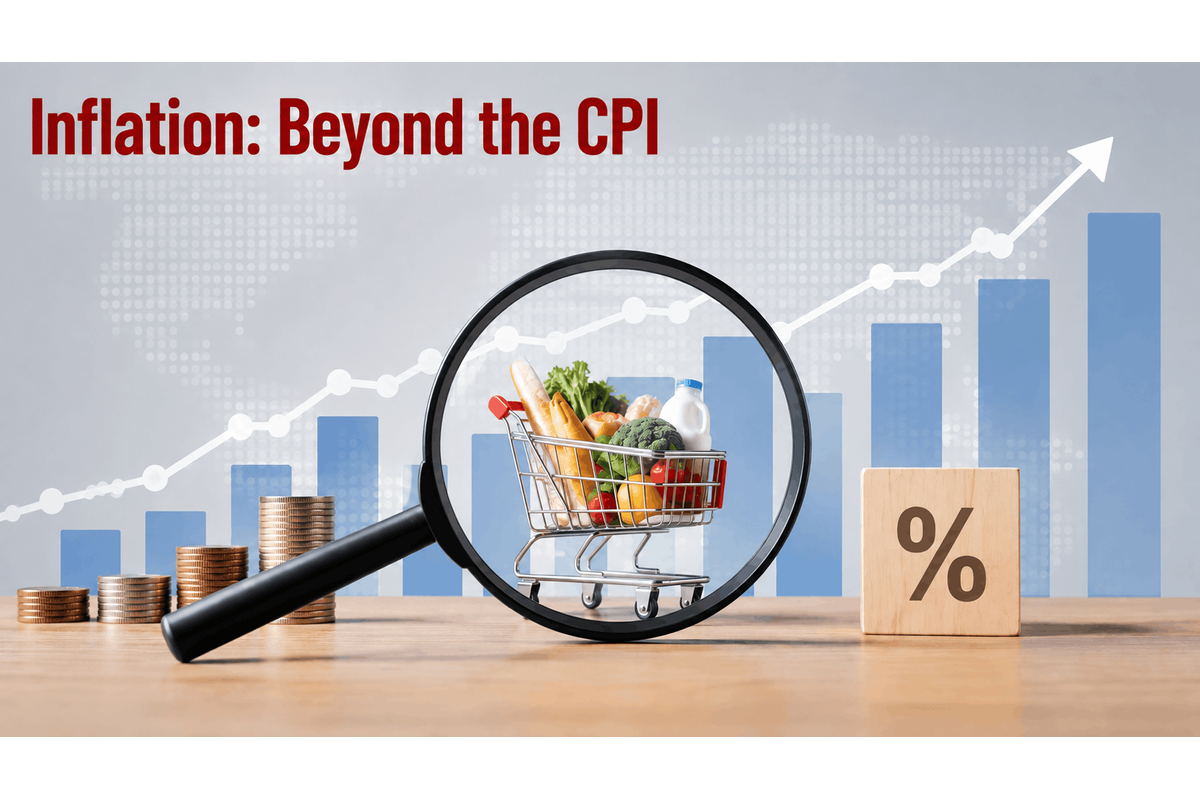
We all intuitively know that prices are rising faster than the Consumer Price Index (CPI) indicates. We feel the pain every time we go to the grocery store or gas station. But just how much is price inflation impacting us here on Main Street?
I started pondering this question the other day when I ran across a graph tracking the price of a can of Campbell’s Tomato Soup since 1895.
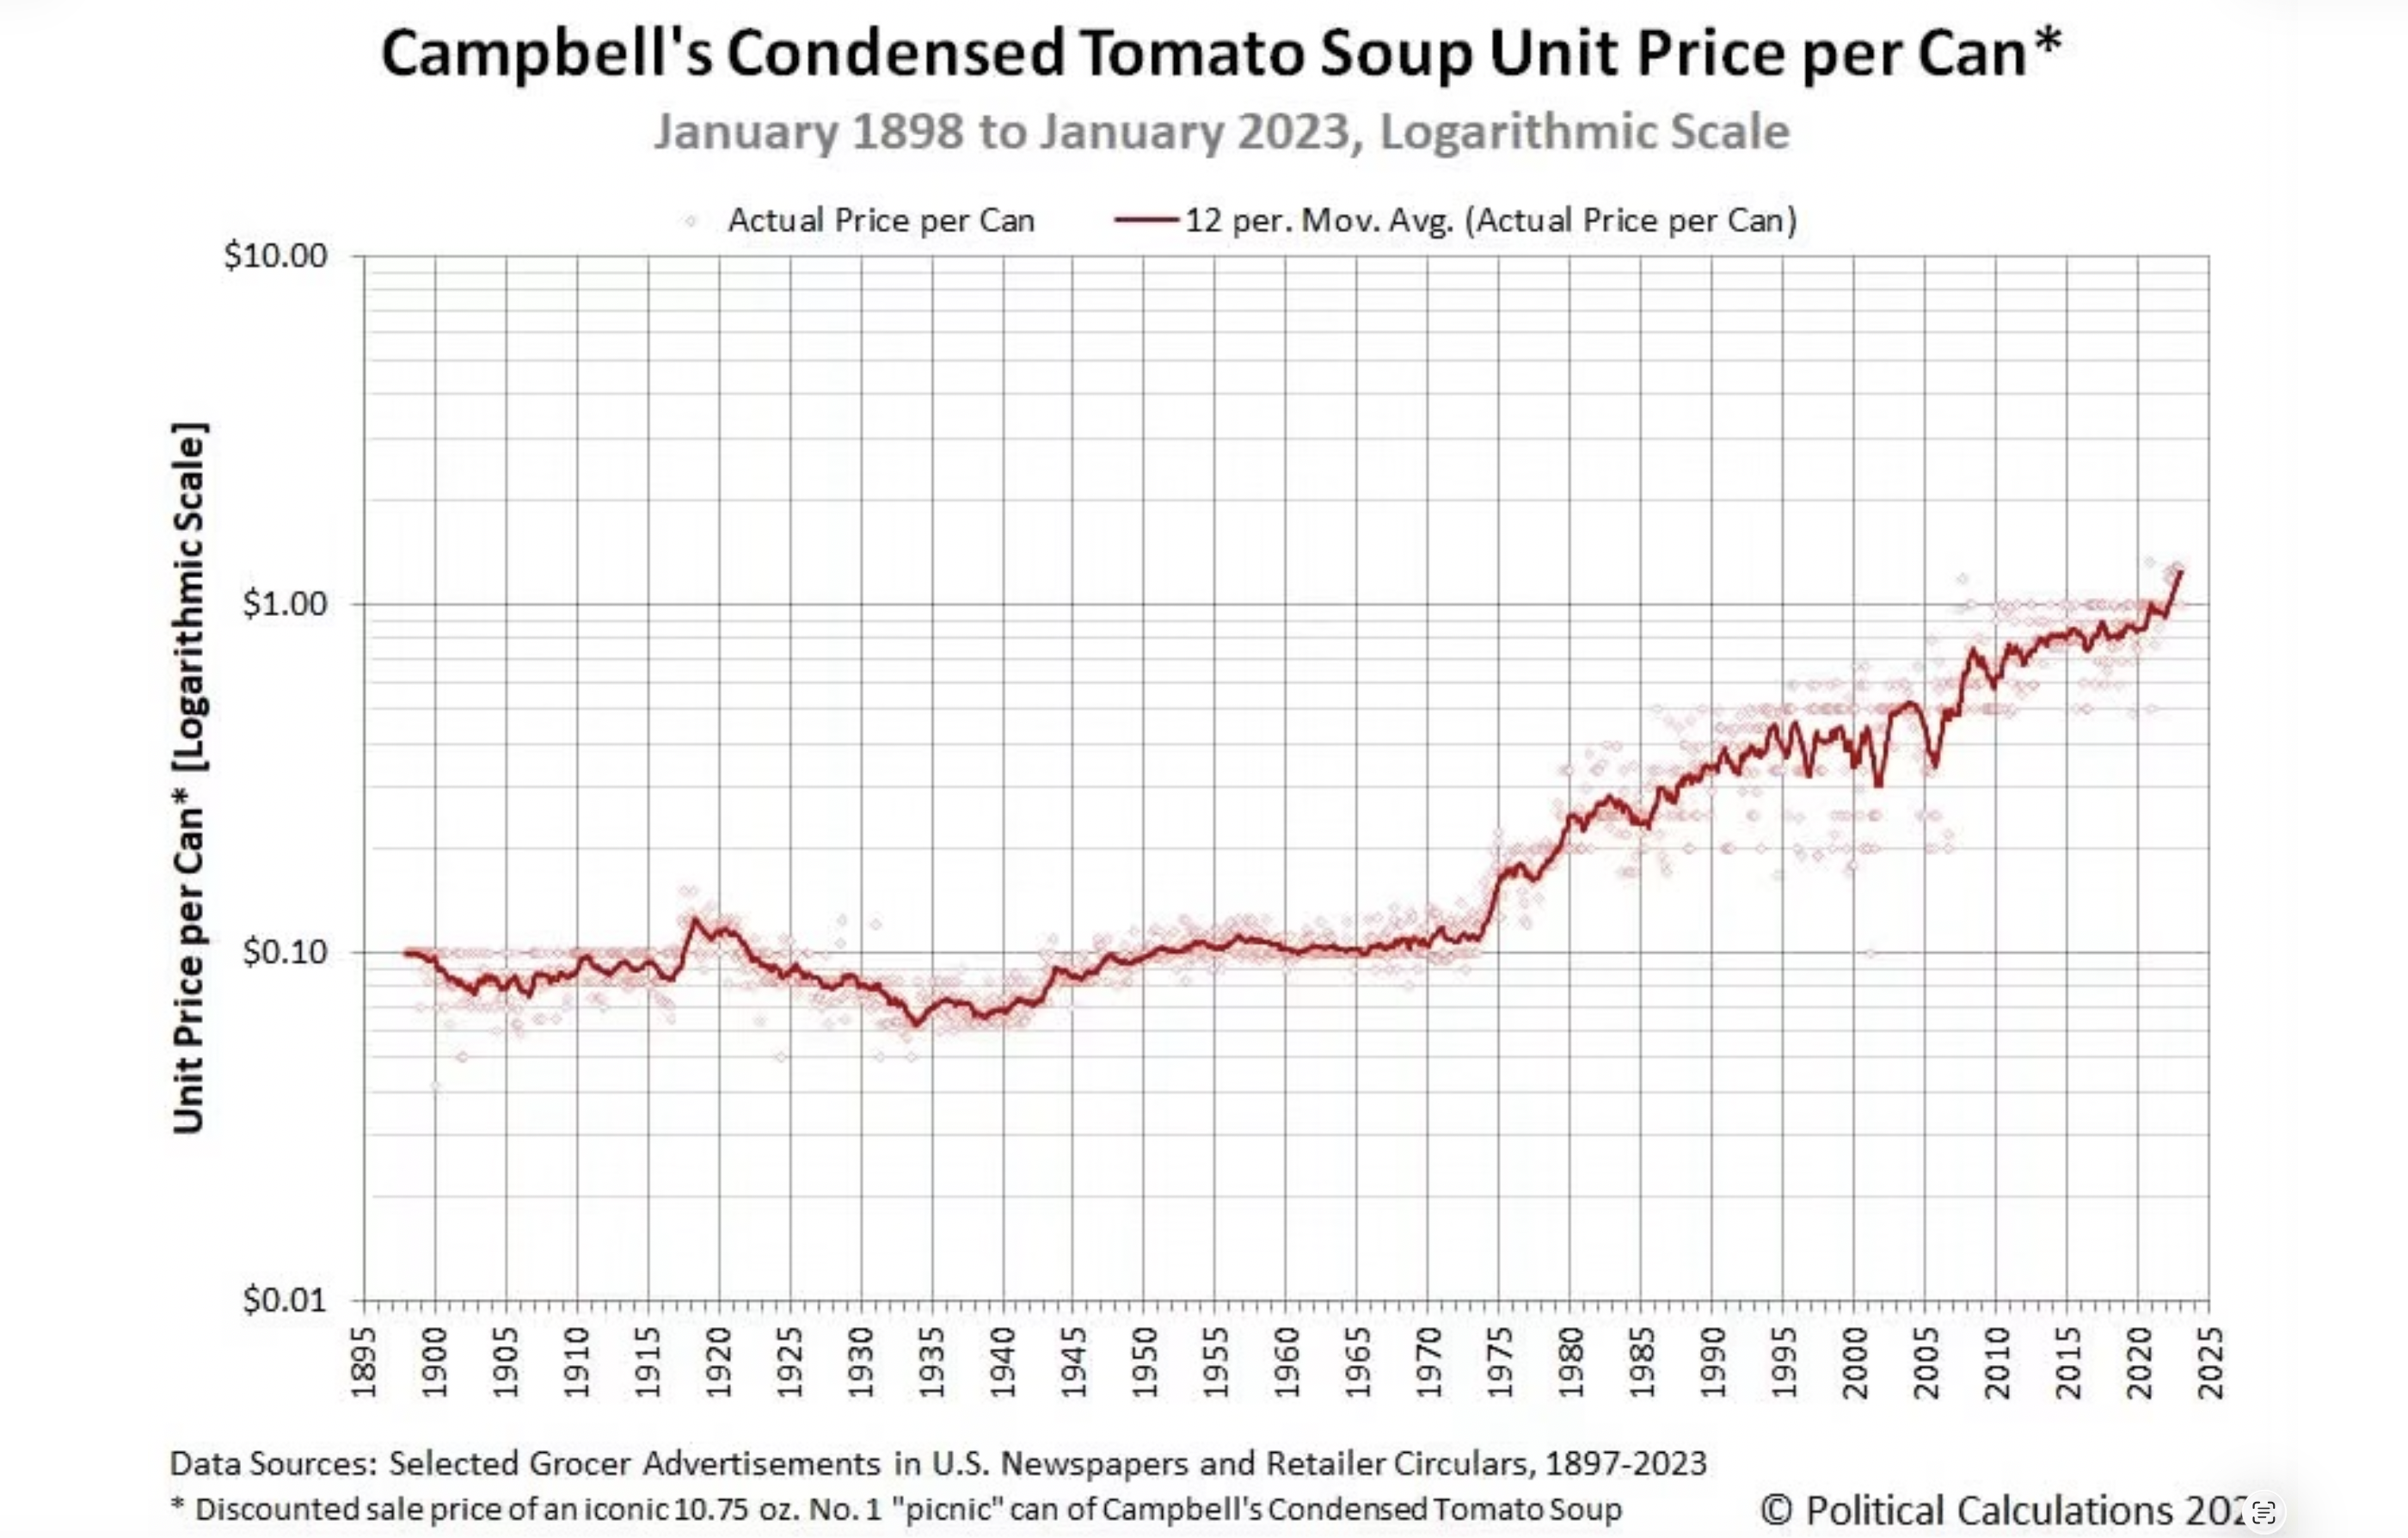
You’ll notice an interesting phenomenon. The cost of a can of soup remained relatively stable until around 1973, when it suddenly started to climb more rapidly.
And what happened in the early 1970s?
In 1971, President Richard Nixon severed the dollar's last connection with the gold standard, making it a purely free-floating fiat currency.
When he announced the closing of the gold window, Nixon said, “Let me lay to rest the bugaboo of what is called devaluation,” and promised, “Your dollar will be worth just as much as it is today.”
Well, Campbell’s begs to differ.
Since that fateful day, the U.S. government, supported by the Federal Reserve, has aggressively devalued the dollar by printing more and more of them. This would have been impossible with the monetary discipline imposed by a gold standard (which is exactly why Nixon did away with it).
According to the Consumer Price Index data released by the Bureau of Labor Statistics, the dollar has lost around 88 percent of its value since Nixon’s fateful decision. Meanwhile, the dollar value of gold has gone from $35 an ounce to about $4,000.
Of course, salaries have gone up as well, but inflationary boosts to income always lag behind prices, meaning this inflationary pressure is decimating the middle class and creating significant socio-economic shifts.
The Current Inflation Picture Is Much Worse Than Advertised
If you go shopping, you’re keenly aware of price inflation. Since January 2021, prices are up between 23.6 percent and 27.1 percent, depending on which metric you choose to use.
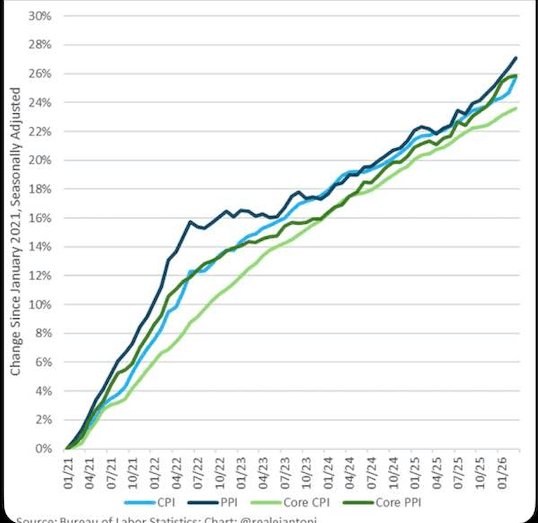
According to the latest CPI data, price inflation ran at 3.5 percent over the last year. That’s well above the mythical 2 percent target.
This paints a pretty bleak inflation picture, but the situation is worse than these dreary government numbers suggest.
How can this be?
Because the CPI formula is constructed to understate price inflation.
In fact, the government revised the CPI formula in the 1990s so that it understated the actual rise in prices even more.
However, the Bureau of Labor Statistics also collects and aggregates data on actual price increases. Using these numbers without all the formulaic manipulation and hedonic adjustments built into the process gives us a better sense of how much more we’re paying at the store.
I had an AI agent take 25 common items from the BLS data and calculate the price increase for that basket of goods over the last five years.
Based on this basket, price inflation is running at 29.3 percent.
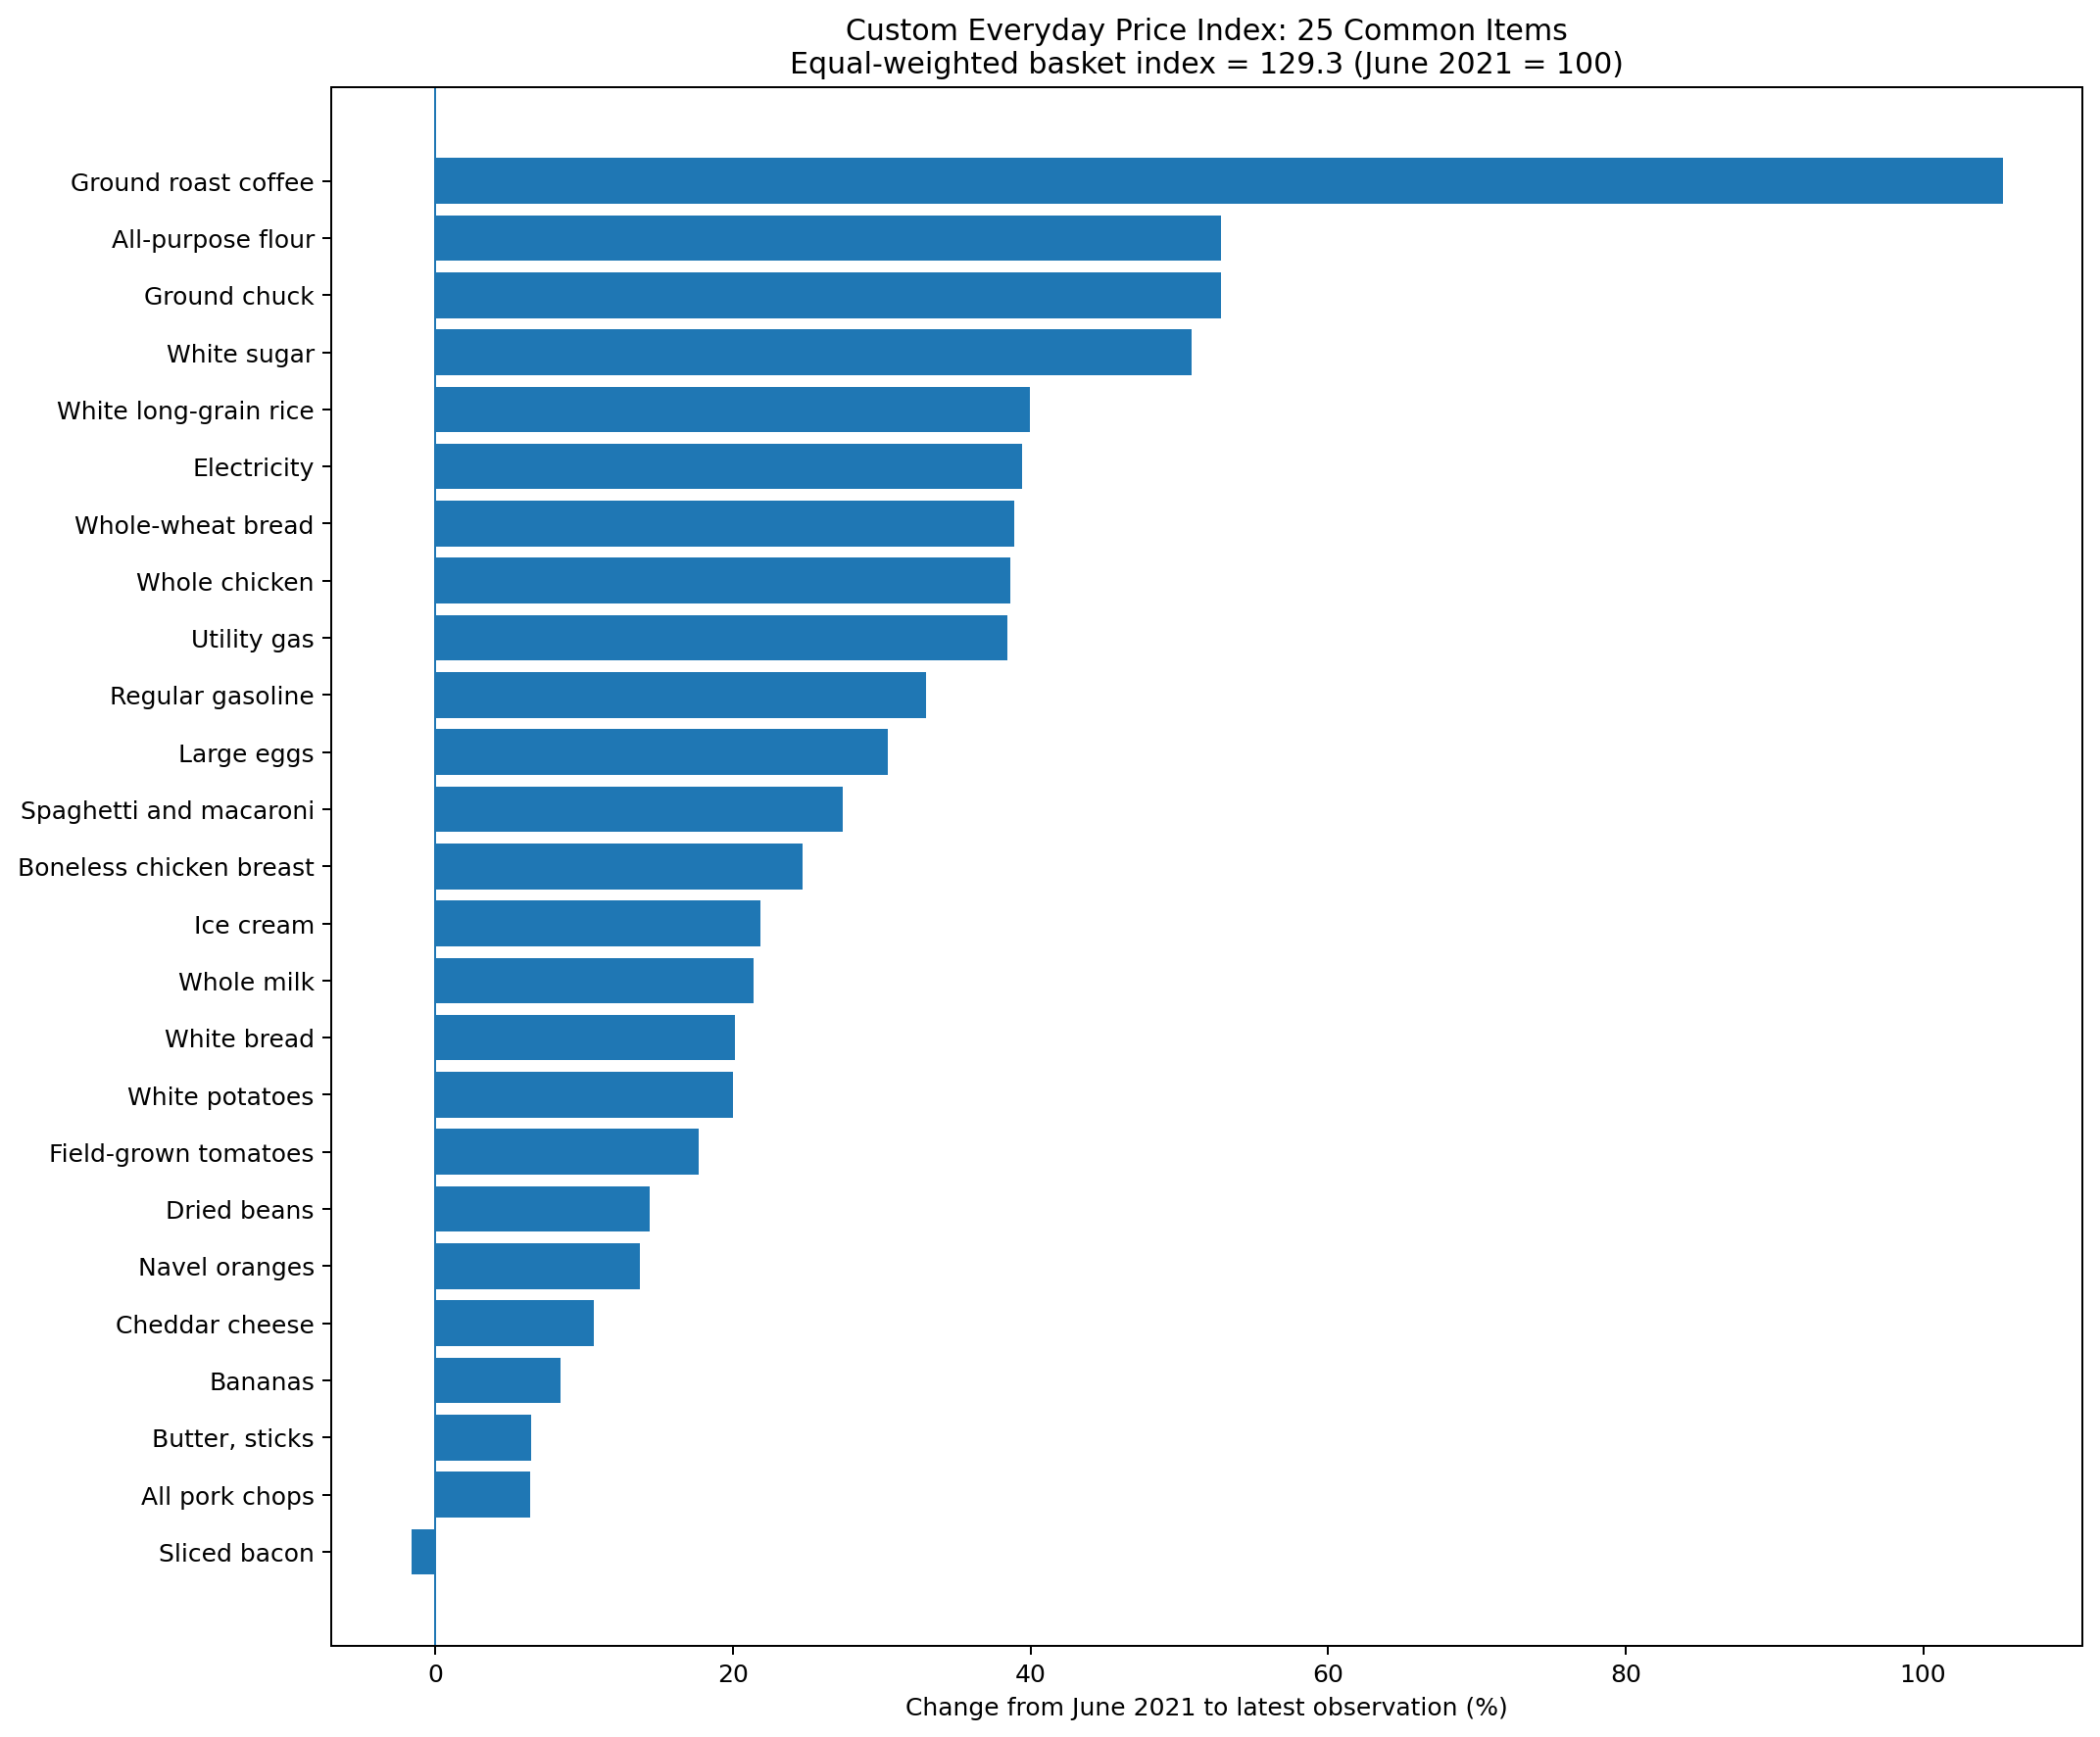
The largest price increases were on the following items.
Ground coffee: 105.4%
All-purpose flour: 52.8%
Ground chuck: 52.8%
White sugar: 50.8%
Long-grain rice: 40.0%
The only price on the list lower than five years ago was bacon.
The bottom line is price inflation is worse than they’re telling you. And they’re telling you it’s pretty bad.
There are all kinds of ways to slice and dice data. We can debate the minutiae, but the trend is undeniable. You’re losing purchasing power at a rapid rate. And no matter how much Fed Chairman Keven Warsh screams about tackling price inflation, nothing will change. Even if they do get it under control (and they can’t), they will continue to devalue the dollar by 2 percent per year as a matter of policy. That means you lose more than 10 percent of your purchasing power every five years.
That’s the plan.
Therefore, you need to plan accordingly. If you’re trying to save and preserve your wealth in dollars, you’re making a huge mistake. You need to save in sound money – gold and silver.

Comments
Log in or sign up to join the conversation.