

Good Monday morning and welcome back. It’s the start of a new week so let’s get right to our objective review the key market models and indicators and see where things stand. To review, the primary goal of this weekly exercise is to remove any subjective notions I might have in an effort to stay in line with what “is” happening in the markets.
The State of the Trend
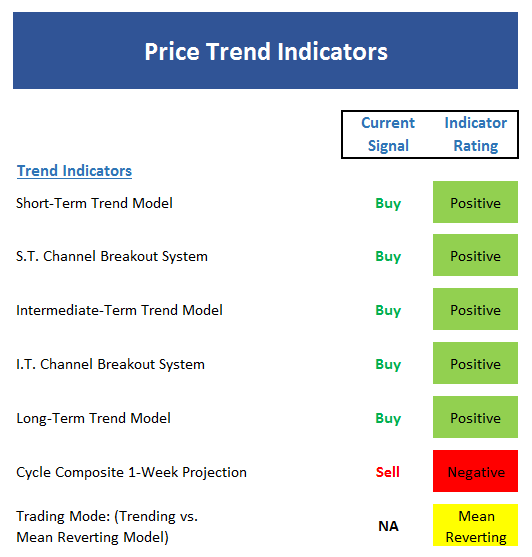
We start each week with a look at the “state of the trend.” These indicators are designed to give us a feel for the overall health of the current short- and intermediate-term trend models.
View Trend Indicator Board Online
Executive Summary:
- With the Dow and S&P 500 closing at new all-time highs on Friday, it is not surprising to see the short-term Trend Model positive.
- Both the short- and intermediate-term Channel Breakout Systems remains positive
- The intermediate-term Trend Model looks good.
- The long-term Trend Model is also a bright shade of green at this time
- The Cycle Composite points down this week before turning up for the next two.
- The Trading Mode models continue to point to a mean-reverting environment
The State of Internal Momentum
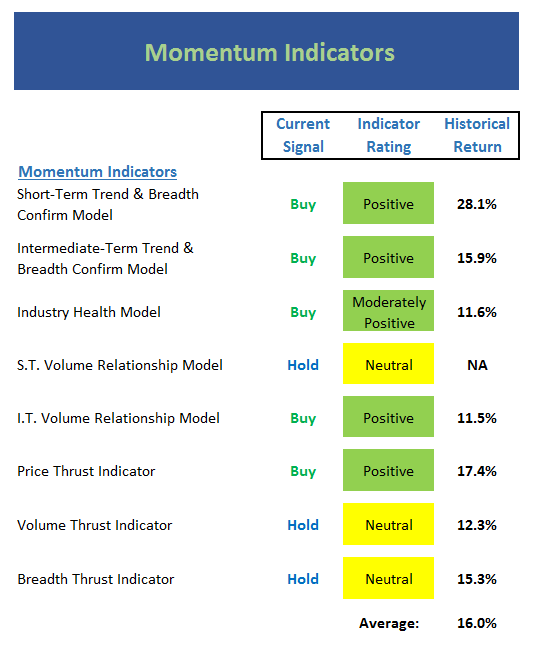
Next up are the momentum indicators, which are designed to tell us whether there is any “oomph” behind the current trend…
View Momentum Indicator Board Online
Executive Summary:
- The short-term Trend and Breadth Confirm Model remains positive
- Our intermediate-term Trend and Breadth Confirm Model has been a good guide lately and is still green
- The Industry Health Model continues to muddle along in moderately positive territory
- The short-term Volume Relationship is positive, but not by much
- After flirting with a breakdown, the intermediate-term Volume Relationship model improved last week and remains positive
- The Price Thrust Indicator moved back to positive last week.
- The Volume Thrust Indicator moved up from negative to neutral. Note that the historical gains in the neutral zone have been above the long-term mean of the market.
- The Breadth Thrust Indicator remains neutral. But like the Volume Thrust indicator, the historical gains in the neutral mode are strong
The State of the “Trade”
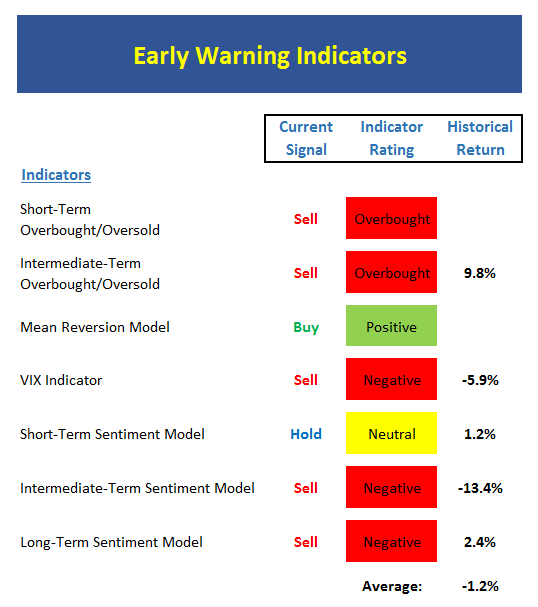
We also focus each week on the “early warning” board, which is designed to indicate when traders may start to “go the other way” — for a trade.
View Early Warning Indicator Board Online
Executive Summary:
- From a near-term perspective, stocks are now in overbought territory.
- From an intermediate-term view, stocks are also in the overbought zone
- The Mean Reversion Model produced a buy signal last week.
- The VIX Indicators are struggling with low readings and remain on sell signals
- From a short-term perspective, market sentiment is neutral
- The intermediate-term Sentiment Model is negative
- Longer-term Sentiment readings are also negative
The State of the Macro Picture
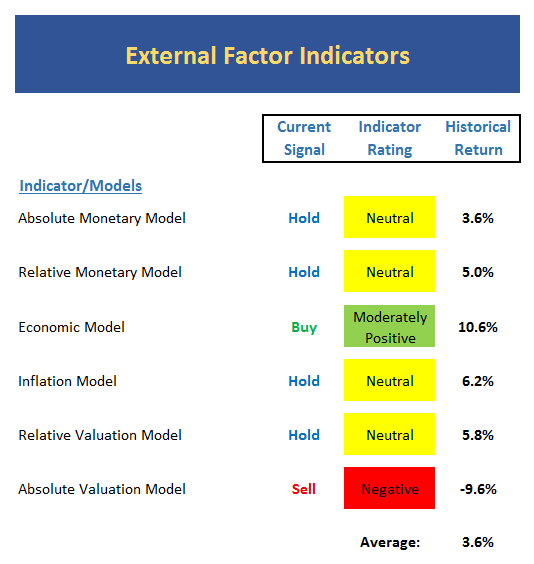
Now let’s move on to the market’s “external factors” – the indicators designed to tell us the state of the big-picture market drivers including monetary conditions, the economy, inflation, and valuations.
View External Factors Indicator Board Online
Executive Summary:
- The recent uptick in rates caused our Absolute Monetary model to slip back to neutral
- On a relative basis, our Monetary Model continues to climb within the neutral zone
- Our Economic Model (designed to call the stock market) remains in good shape
- The Inflation Model – which has done a great job of calling the trend of inflation for the past year – continues to fall within the neutral zone
- Our Relative Valuation Model has improved modestly but remains neutral
- The Absolute Valuation Model continues to sport a bright shade of red
The State of the Big-Picture Market Models
Finally, let’s review our favorite big-picture market models, which are designed to tell us which team is in control of the prevailing major trend.
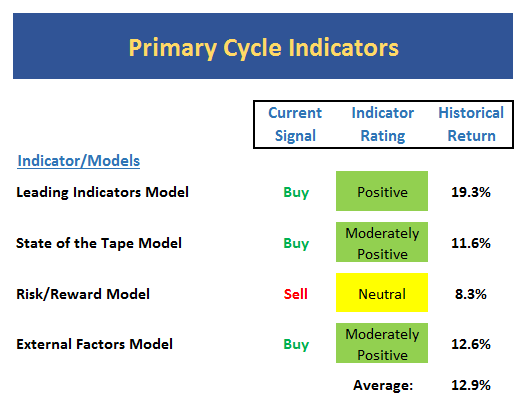
View My Favorite Market Models Online
Executive Summary:
- The Leading Indicators model, which was our best performing timing model during the last cycle, continues on a buy signal. However, the overall model reading is well below recent levels.
- The Tape remains moderately positive
- The last signal of the Risk/Reward model was a sell. However, the model is currently in the neutral zone.
- The External Factors model has been “movin’ on up” lately and is approaching an outright positive reading
The Takeaway…
As the saying goes, the most bullish thing a market can to is make new highs. And with the majority of the key indicators in decent shape, one really shouldn’t complain too loudly about the state of the market. However, as I’ve been saying for some time now, this does not appear to be a low risk environment. So, given the level of valuations and where we are on the calendar, I believe the best course of action is to remain invested in stocks but utilize a lower risk profile where possible – just in case.



Comments
Log in or sign up to join the conversation.