
Sadly, the first week of October starts with the news of the deadliest gunman attack in U.S. history. So, let me first say that our thoughts and prayers go out to the victims, the injured, and all those traumatized by the sickening attack that occurred in Las Vegas last night.
My second thought this morning may not win me many friends as I normally try to avoid any political commentary in my morning market missives. However, in light of this event, I simply have to say it; why on earth these types of weapons available for purchase by the public?
To be sure, this type of event makes it tough to focus on mundane things like investing. However, the stock market will open in less than an hour, so let’s go ahead and review my key market models/indicators and see where we stand. To review, the primary goal of this exercise is to try and remove any subjective notions about what “should” be happening in the market in an attempt to stay in line with what “is” happening in the markets. So, let’s get started.
The State of the Trend
We start our review each week with a look at the “state of the trend.” These indicators are designed to give us a feel for the overall health of the current short- and intermediate-term trend models.
Executive Summary:
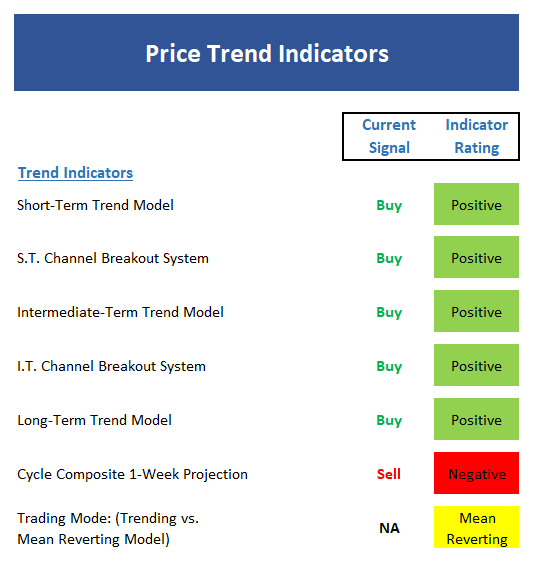
- The short-term Trend Model is back to positive with the S&P closing a fresh all-time highs.
- The short-term Channel Breakout System remains on a buy signal. This system’s stop point stands at 2488 to start the week.
- The intermediate-term Trend Model is also positive.
- The intermediate-term Channel Breakout System did a great job issuing a buy signal on 8/22. The system would require a drop below 2443 to leave the positive zone.
- The long-term Trend Model remains solidly green.
- The Cycle Composite remains negative and is clearly out of sync from a short- and intermediate-term perspective at this time.
- The Trading Mode models are not yet convinced that the trend is “in gear” but one of the models is positive and the other two are moving in the right direction.
- In sum, as the saying goes, the most positive thing a market can do is make new highs. Now if the Dow and NASDAQ 100 would just confirm.
The State of Internal Momentum
Next up are the momentum indicators, which are designed to tell us whether there is any “oomph” behind the current trend…
Executive Summary:
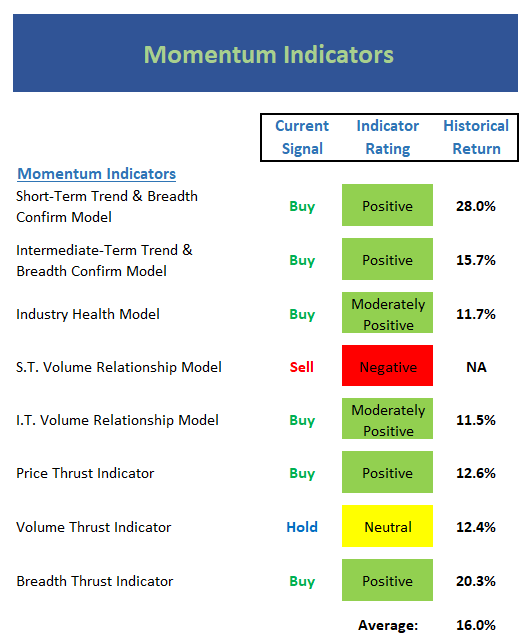
- Both the short- and intermediate-term Trend and Breadth Confirm Models are positive.
- The Industry Health Model continues to waffle in the moderately positive zone. As I’ve said many times, I would prefer to see this model in an outright positive mode.
- The short-term Volume Relationship remains negative and is not improving here. While the indicator could certainly turn in the near-term, this is a nagging concern
- The intermediate-term Volume Relationship has upticked and is improving.
- The Price Thrust Indicator remains positive.
- The Volume Thrust Indicator continues with a neutral reading. But we should note that the historical return in neutral is fairly strong.
- The Breadth Thrust Indicator remains positive this week.
- From a momentum perspective, the bottom line is things are pretty good. However, I would like to see the volume relationship model confirm the overall message in the near-term.
The State of the “Trade”
We also focus each week on the “early warning” board, which is designed to indicate when traders may start to “go the other way” — for a trade.
Executive Summary:
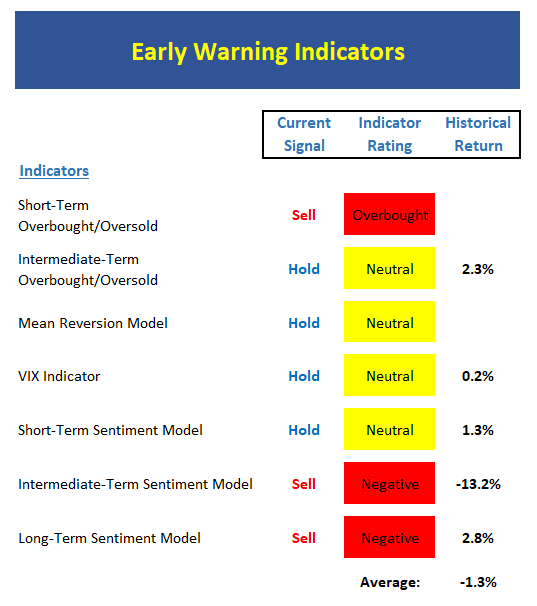
- From a near-term perspective, stocks are once again overbought. However, it has been a more than a month since the S&P was oversold and as such, the bulls will argue that this is becoming a “good overbought” condition.
- From an intermediate-term view, stocks are have reached an overbought condition as well. However, we prefer for these indicators to reverse from an extreme position before turning negative.
- The Mean Reversion Model
- The shorter-term VIX Indicator has issued a sell signal while the intermediate-term model’s last signal was a buy.
- From a short-term perspective, market sentiment is become more optimistic but has not yet reached a level that is considered negative.
- The intermediate-term Sentiment Model remains negative and the indicator hasn’t budged.
- Longer-term Sentiment readings are worsening and approaching the lowest levels of the year.
- Yes, stocks are now overbought from short-, intermediate-, and long-term timeframes. But it is important to remember, that overbought conditions can remain in effect for long periods of time when the bulls are running.
The State of the Macro Picture
Now let’s move on to the market’s “external factors” – the indicators designed to tell us the state of the big-picture market drivers including monetary conditions, the economy, inflation, and valuations.
Executive Summary:
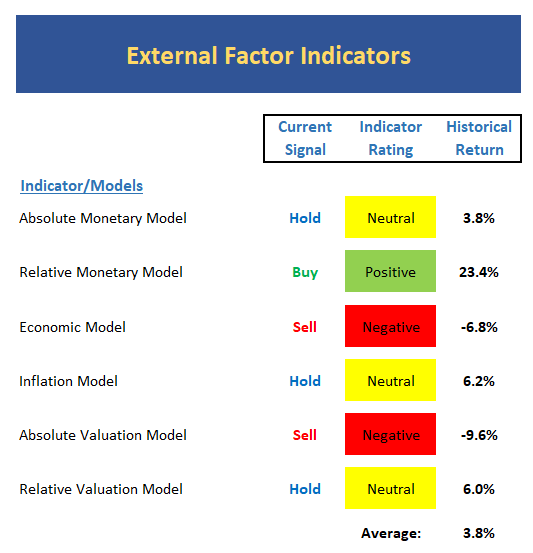
- Absolute Monetary conditions continue to weaken with the recent spike in rates.
- But… the Relative Monetary Model remains upbeat. The divergence between the two models has to do with the overall level of rates.
- Our Economic Model (designed to call the stock market) issued a sell signal last week. However, I note that the model designed to “call” the economy remains positive.
- The Inflation Models continue to show weakening inflation pressures.
- The Absolute Valuation Model remains negative. However, we should recognize that the trend of the model reading is slightly down. As such, one can argue that valuations are improving – albeit from extreme levels.
- On the other hand, our Relative Valuation Model continues to improve and is very close to turning positive.
The State of the Big-Picture Market Models
Finally, let’s review our favorite big-picture market models, which are designed to tell us which team is in control of the prevailing major trend.
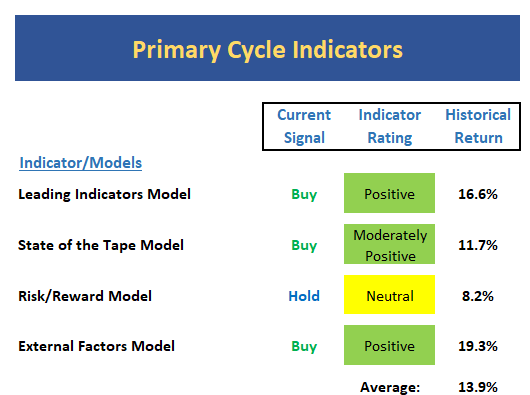
Executive Summary:
- The Leading Indicators model, which was our best performing timing model during the last cycle, remains positive after giving a whipsaw signal earlier in the year.
- The overall message from “the tape” remains constructive, but it could be better with stocks at all-time highs.
- The Risk/Reward model continues to suggest this is not a low-risk environment
- The External Factors model sums things up nicely here from a big-picture perspective. While there are concerns, this composite of external indicators remains green.
MY TAKEAWAY…
I think the takeaway from this week’s indicator review is that despite the confluence of “issues” the bears continue to talk about, the market remains at all-time highs. Some will argue that this represents a classic case of stocks climbing a wall of worry. And with the majority of our indicators in decent shape, I can concur with this analysis. However, there are indeed some chinks in the indicator armor here. Of course, these problem areas could also be resolved with some time. So, with very positive seasonality just around the corner, it is probably a good idea to give the bulls the benefit of the doubt here and to continue to buy any/all dips.
SAMPLE RISK EXPOSURE SYSTEM
Below is an EXAMPLE of how some of above indicators might be used in order to determine exposure to market risk. The approach used here is a “Model of Models” comprised of 10 independent Models. Each model included gives separate buy and sell signals, which affects a percentage of the model’s overall exposure to the market.
Trend models control a total 40% of our exposure. The 3 Momentum Models and 3 Environment Models each control 10% of the portfolio’s exposure to market risk. The model’s “Exposure to Market Risk” reading (at the bottom of the Model) acts as an EXAMPLE of a longer-term guide to exposure to market risk.
In looking at the “bottom line” of this model, my take is that readings over 75% are “positive,” readings between 50% and 75% are “moderately positive,” and readings below 50% should be viewed as a warning that all is not right with the indicator world.
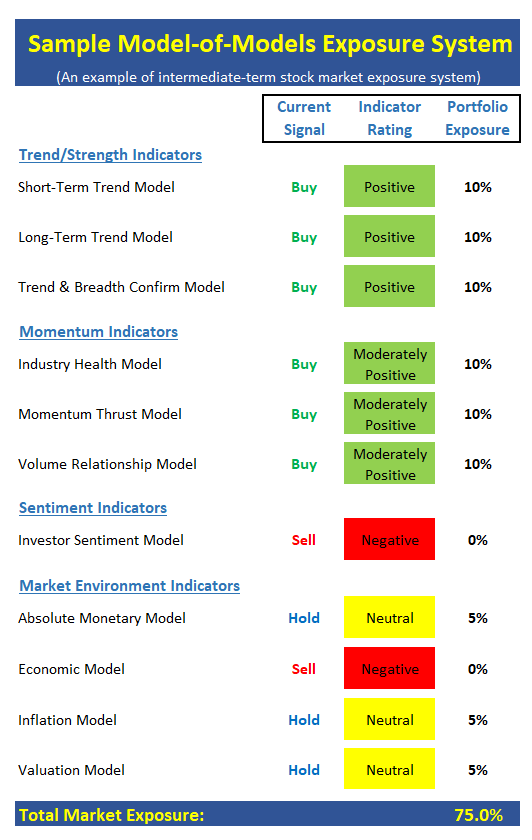
The model above is for illustrative and informational purposes only and does not in any way represent any investment recommendation. The model is merely a sample of how indicators can be grouped to create a guide to market exposure based on the inputs from multiple indicators/models.
THOUGHT FOR THE DAY:
It requires less character to discover the faults of others, than to tolerate them. -J. Petit Senn
CURRENT MARKET DRIVERS
We strive to identify the driving forces behind the market action on a daily basis. The thinking is that if we can both identify and understand why stocks are doing what they are doing on a short-term basis; we are not likely to be surprised/blind-sided by a big move. Listed below are what we believe to be the driving forces of the current market (Listed in order of importance).
1. The State of Geopolitics
2. The State of the Economic/Earnings Growth (Fast enough to justify valuations?)
3. The State of the Trump Administration
4. The State of Fed Policy


Comments
Log in or sign up to join the conversation.