
Before we let the blinking screens take over our lives again, let’s step back and look at the state of the market and review our objective major market indicators/models.
The first step is a review of the price/trend of the market. Here’s my current take on the state of the technical picture…
- The stand-off continues unabated as stocks sideways now for 10 days
- Some would call current chart formation a wedge
- Some would call current chart formation a flag
- Either way, the key is that a breakout of the formation is likely coming soon
- Bulls looking for a move above 2180
- Bears looking for a move below 2140
S&P 500 – Daily
(Click on image to enlarge)

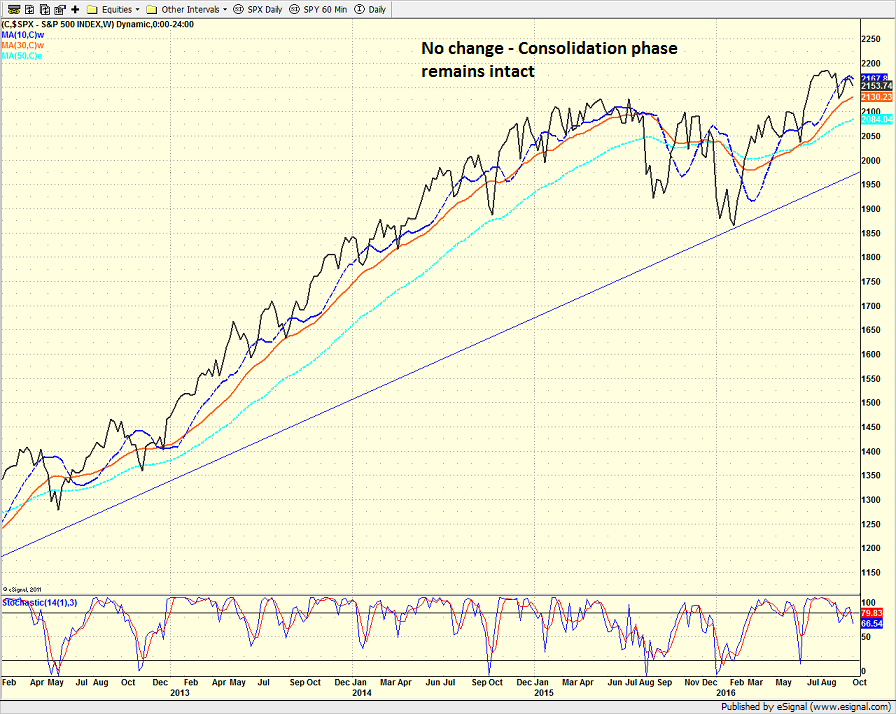
From a longer-term perspective (e.g. looking at a weekly chart of the S&P 500)…
- Nothing new to report from a longer-term charting perspective
- Consolidation phase remains intact
- Bullish formation unless meaningful break below 2130 on weekly chart
- Bulls would prefer a break to new highs
- Recall that all breakouts have led to reversals from near-term perspective
S&P 500 – Weekly
Next, let’s look at the “state of the trend” from our indicator panel. These indicators are designed to give us a feel for the overall health of the current short- and intermediate-term trend models.
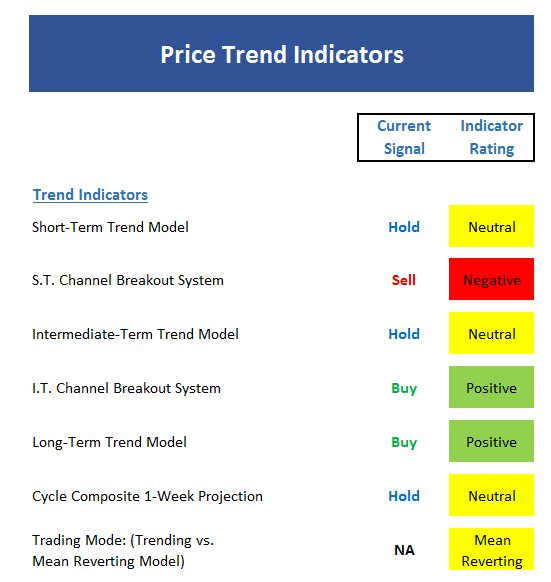
- Can you say, “conflicted?”
- About the only thing that this board agrees on is the short- and intermediate-term trends are neutral
- One channel breakout is on a buy, the other on a sell
- Cycle composite points sideways to slightly lower this week
- Mean reversion mode persists
- Overall, the board is neutral, which isn’t a bad thing considering the length of the current consolidation
Now we turn to the momentum indicators…
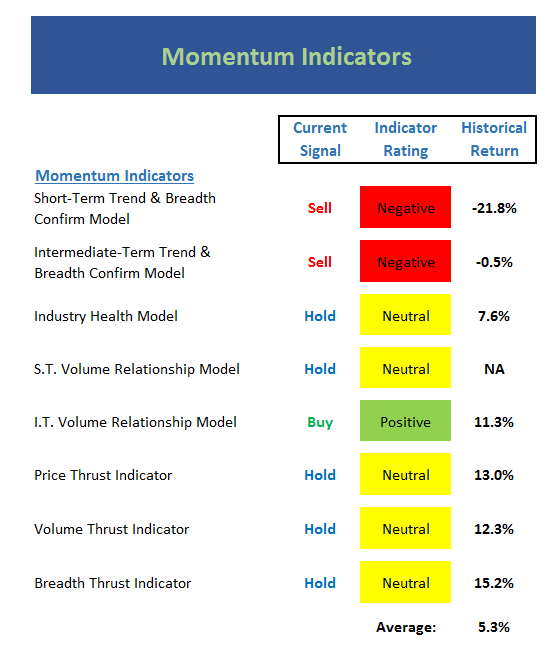
- Both Trend & Breadth confirm models are negative, but only by a smidge
- S.T. Volume Relationship model is also only neutral by a hair
- Not surprisingly, all the Thrust indicators have moved to neutral
- Industry Health model is hanging in there, which is a positive
- Again, given the length of the current consolidation, this board could be much worse
Next up is the “early warning” board, which is designed to indicate when traders may start to “go the other way” — for a trade.
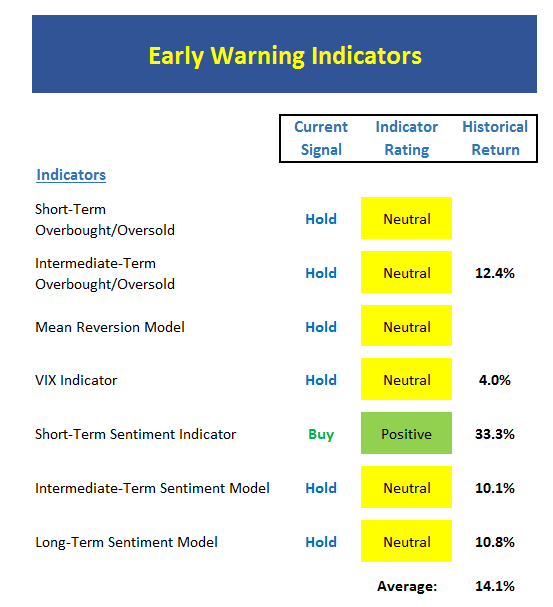
- Unfortunately for both teams, the Early Warning board is almost completely neutral
- The shorter-term sentiment model is the lone bright spot as sentiment is pretty negative at this time (a good thing from a contrarian standpoint)
- All 3 trading mode models point to mean-reversion at this time
- The VIX remains in never-never land
- This board suggests neither team has an edge in near-term
Now let’s move on to the market’s “external factors” – the indicators designed to tell us the state of the big-picture market drivers including monetary conditions, the economy, inflation, and valuations.
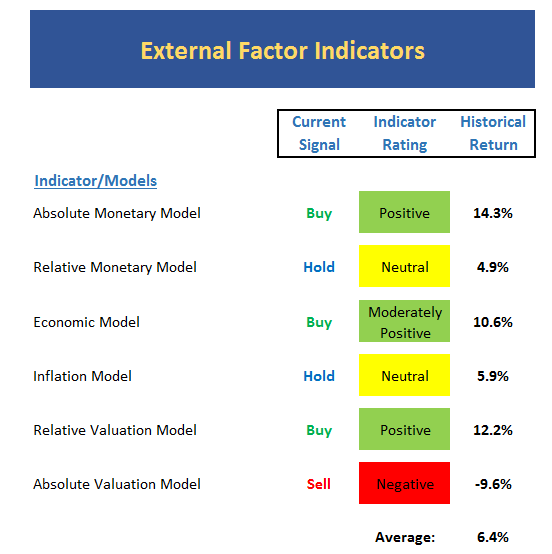
- This board is little changed from last week
- Monetary conditions continue to be a tailwind for stocks, although the wind is less strong than it was a few months back
- The Economic model and its primary components are in pretty good shape
- The Inflation model continues to point to growing inflation pressures, something the Fed likely sees
- The Absolute Valuation model didn’t change modes, but the levels did improve slightly last month
Finally, let’s review our favorite big-picture market models, which are designed to tell us which team is in control of the prevailing major trend.
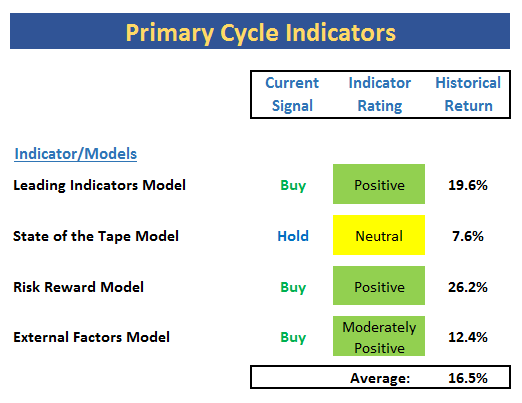
- Nothing new to report here…
- The big-picture models suggest that while this not a pound-the-table bullish environment, the bulls should be given the benefit of any doubt
- Dips should be bought
The Takeaway…
While the action has been frustrating lately, it has been playing out largely in line with the seasonal pattern. The good news is the cycle composite turns positive in a couple weeks. In the meantime, we should be looking for clues as to whether the bulls have enough ammunition to produce a meaningful breakout, which, in my humble opinion, would likely lead to the traditional year-end rally. And as I mentioned above, the bulls should be given the benefit of the doubt here and the dips should continue to be bought.
Current Market Drivers
We strive to identify the driving forces behind the market action on a daily basis. The thinking is that if we can both identify and understand why stocks are doing what they are doing on a short-term basis; we are not likely to be surprised/blind-sided by a big move. Listed below are what we believe to be the driving forces of the current market (Listed in order of importance).
1. The State of German/European Banks
2. The State of Global Central Bank Policies
3. The State of U.S. Economic Growth
Thought For The Day:
Never stand begging for that which you have the power to earn. – Miguel de Cervantes


Comments
Log in or sign up to join the conversation.