
Shortly after the EU, referendum in the United Kingdom showed a ‘Vote Leave,’ outcome the price of crude oil declined by 7%. However, given the falling stockpiles and the drop in US crude production, many are wondering if a buying opportunity has arrived. There are multiple questions on the table that will be discussed here, but if a recession is avoided and the oil market continues to move toward a demand and supply balance than the trend can live on in Q3 2016.
The Upcoming Risks
As mentioned above, the oil market has moved towards a demand and supply balance from earlier in the year causing the price of oil to rise over 80% from its lowest level in 12 months. As demand picked up, crude stockpiles declined week after week showing investors that crude was in demand, and the pullback of production may present a tinderbox for a bull market in crude oil that could recap much of the losses from 2014 to 2016.
The growth picture remains in doubt as fundamental data from China, and the United States are tepid at best despite more stimulus than many investors originally expected. Given the uncertain outlook, many wonder whether a potential rise of protectionism would bring about a recession and many of the world’s strongest economies. If a recession does develop, we would likely see inventories begin to build again in Cushing Oklahoma, Singapore and Rotterdam that would signal the price of oil likely needs to fall to reflect the new economic realities.
The Upcoming Opportunities
If a recession does not appear in leading economies like China and the United States, we could be witnessing a great buying opportunity in crude oil and other commodities that have fallen in the wake of the EU referendum added United Kingdom. Even though the US dollar strengthened after the referendum, avoiding a global recession would likely bring the dollar lower and further ease constraints on global industrial demand.
Also worth watching to see if WTI Crude Oil demand is picking up or slowing down is the Atlanta GDP Now and the ISM data that also tracks growth measures. In late June, the Atlanta GDP Now came in at 2.6%. If you see a move above 3% in the reading, that could be concurrent with demand beginning to exceed expectations and further upside the price of crude oil could be warranted.
The Institute of Supply Management monthly reading can also be a useful guide to show if the economy is growing in such a way as to necessitate higher oil prices given the drop in US crude productions.
Regardless of the two scenarios mentioned above, you can find guidance by keeping an eye on the ISM. ISM or GDP can whether we see an increasing risk of a global recession if China and US Economic data fail to pick up or resumption of growth in Q3 that leads to higher Oil prices you can likely see this trend from the ISM and whether we remain north of 50 for the majority of Q3.
ISM can be found at the first of the month, and the recent May reading that came out on June 1, was 51.3. The 10-month correlation of ISM & WTI Crude Oil on a monthly close basis is 0.73, which is considered a significant positive correlation.
Monthly Institute for Supply Management with Crude Oil (Monthly Close Price) Overlay
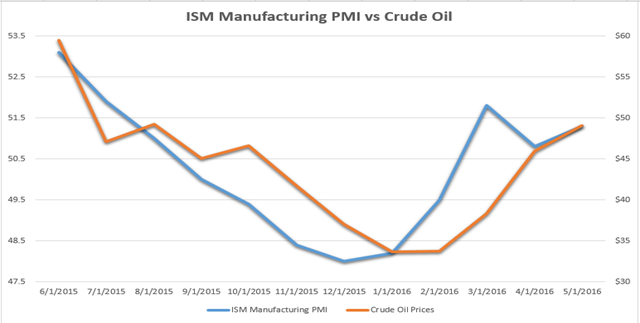
Table Created by Tyler Yell, Currency Analyst. Data Source: Bloomberg
The Intermarket Relationships Worth Watching
Dollar declines historically support the price of oil whereas dollar uptrends often pressure the commodity. The chart below shows the FXCM Dow Jones dollar index peaking at the very end of January 2 weeks before the price of crude oil had a 12-year low. The US dollar does appear to have found support in the 11,650 zone, and only a break below here would favor an aggressive move higher in the price of oil based on this Intermarket relationship.
If the dollar index is looking at a potential triple bottom and begins to break higher a move lower in crude oil could be the likely outcome. Therefore, either a weakening of the US dollar or a sideways moves in the US dollar plus an uptick in the ISM number or GDP now what ideally provide fundamental support for the bullish trend in oil from Q2 2016 to continue to Q3.

US Oil and USDollar Daily Chart - Created by Tyler Yell, Currency Analyst with Trading View Charts on DailyFX.com
Technicals: Inter-market Analysis & 200-DMA are Standing in the Way of a 61% Rally in Crude Oil Extending
The technical bias for WTI Crude Oil (Ticker:USOil) has shifted with prices now trading over its 200 day SMA (Simple Moving Average). This shift is technically significant as before April 2016, Crude Oil had previously traded beneath this average for 20 consecutive months. Now prices action is trading above the average, but Oil prices have declined significantly after putting in a new 2016 high at $51.64.

Oil Daily Chart Created by Walker England, Trade Instructor with Trading View Charts on DailyFX.com
Traders should note that current price action for Crude Oil is consolidating in a descending triangle. This triangle which appears below, has been created by drawing a descending value of resistance by connecting a series of swing highs for the month of June. Alternatively, horizontal support may be found near $45.81. Prices have recently tested this value earlier in the month, and are now seen bouncing from support. If Crude Oil continues to consolidate, traders should watch for prices to again approach resistance, now found near $49.00.

Oil Daily Chart Created by Walker England, Trade Instructor with Trading View Charts on DailyFX.com
With the recent volatility in Crude Oil prices, traders should continue to monitor the market for a breakout. A breakout above triangle resistance would be significant as it would open Oil up for a continuation rally. In this scenario, traders should look for price action to move towards the previous swing high at $50.41. Traders may elect to extrapolate a 1X extension of the triangle to find initial bullish targets near 54.83. In the event of bearish reversal, traders should look for a breakout below support at $45.81. A 1X extension of the triangle places preliminary bearish targets near $39.98. It should be noted that at this point, Crude Oil would be trading back beneath its 200 day SMA. At which point the uptrend previously mentioned would be considered invalidated.


Comments
Log in or sign up to join the conversation.