


Along with the employment report, real income and spending are probably the most important monthly reports as to the health of the average American household. This year there has been a real split between the income and spending sides of that ledger, which continued in this month’s report for July.
To summarize:
1. Real income improved for the month (reflecting lower gas prices) but continues being recessionary.
2. Real spending was tepid and in some important respects negative for the month, but continues being expansionary.
3. The savings rate increased, possibly reflecting increased consumer caution, while real sales continued to climb.
Here’s a more in-depth look.
Real Income:
Nominal income rose 0.4% in July and was up 3.7% YoY. But after adjusting for the price deflator (blue), they only rose 0.2% for the month and were totally stagnant YoY. Further, once we take government transfers into account (red), while the monthly change was also 0.2%, on a YoY basis they were down -0.4%. Here is what the absolute numbers look like:
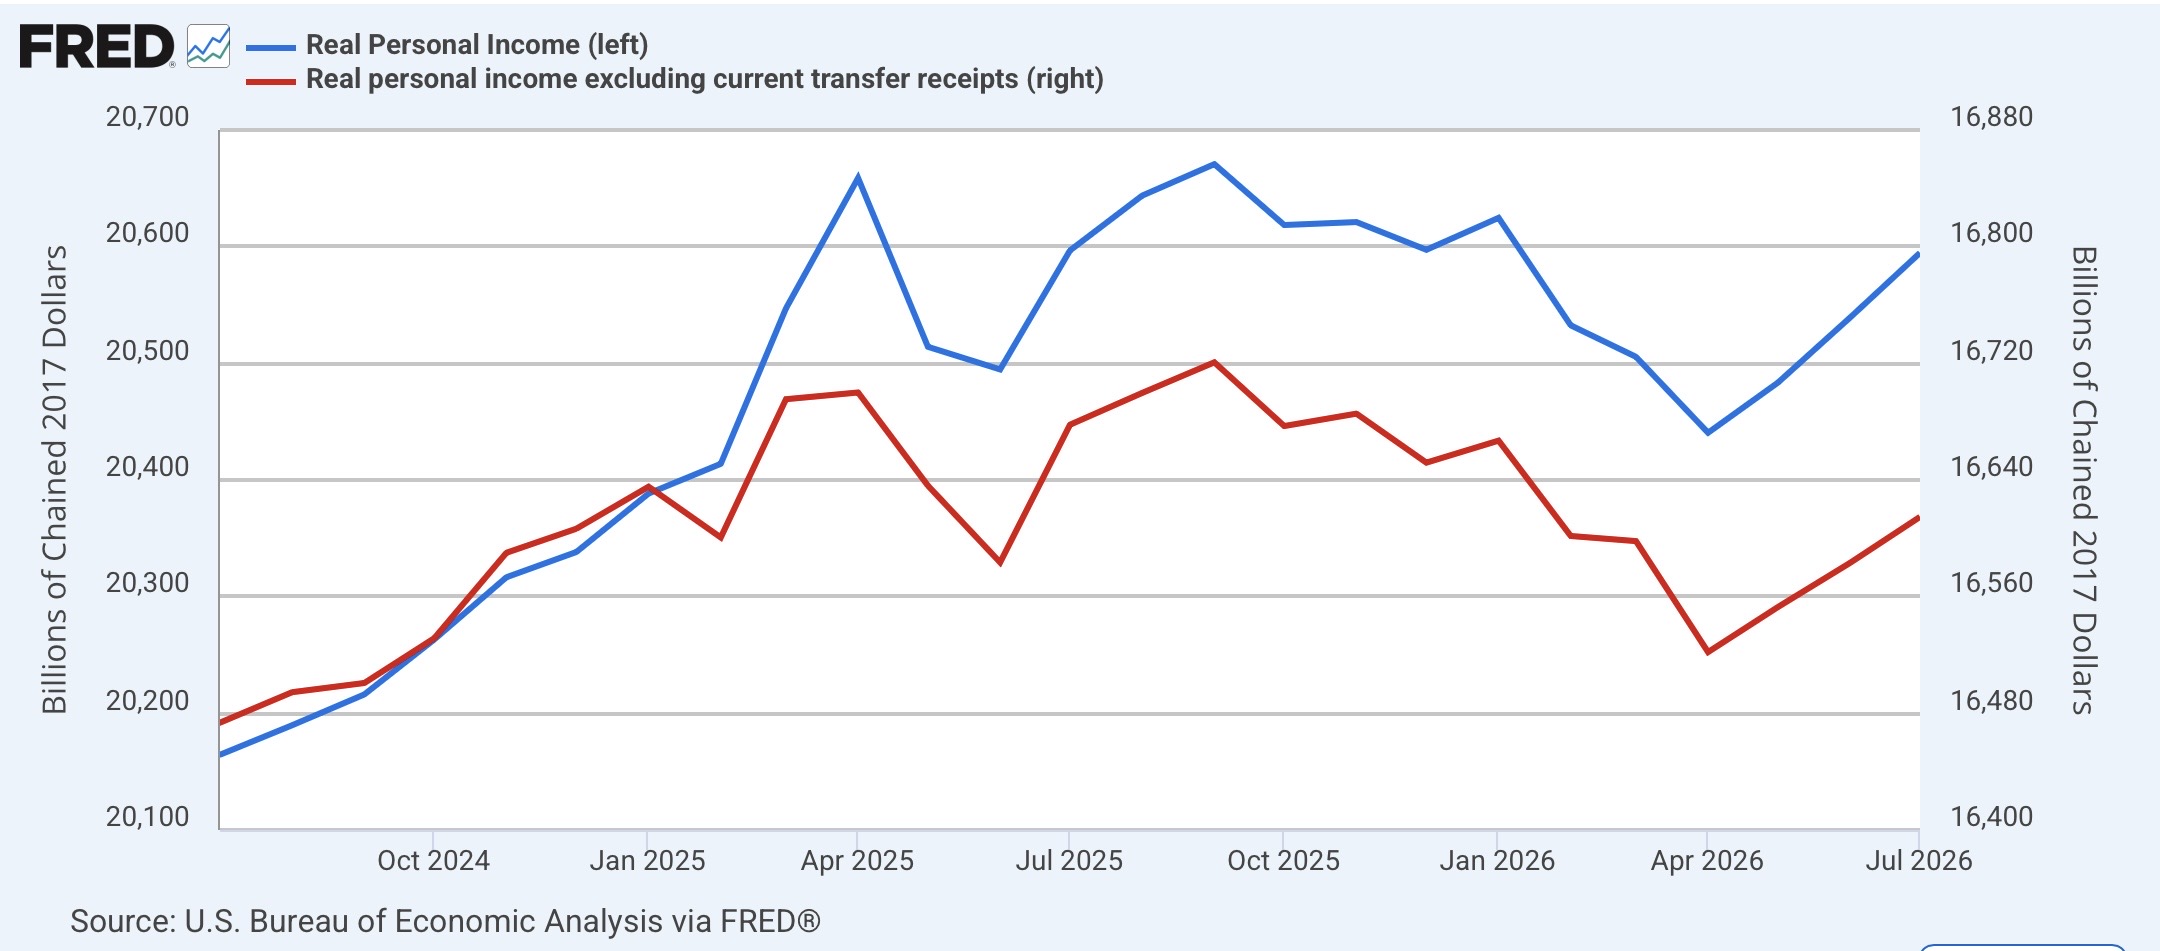
The big increase in gas prices in March and April pushed incomes down, while the declines in prices thereafter have helped push them up. But they remain significantly below last year’s peaks.
Here is the post-pandemic look YoY:
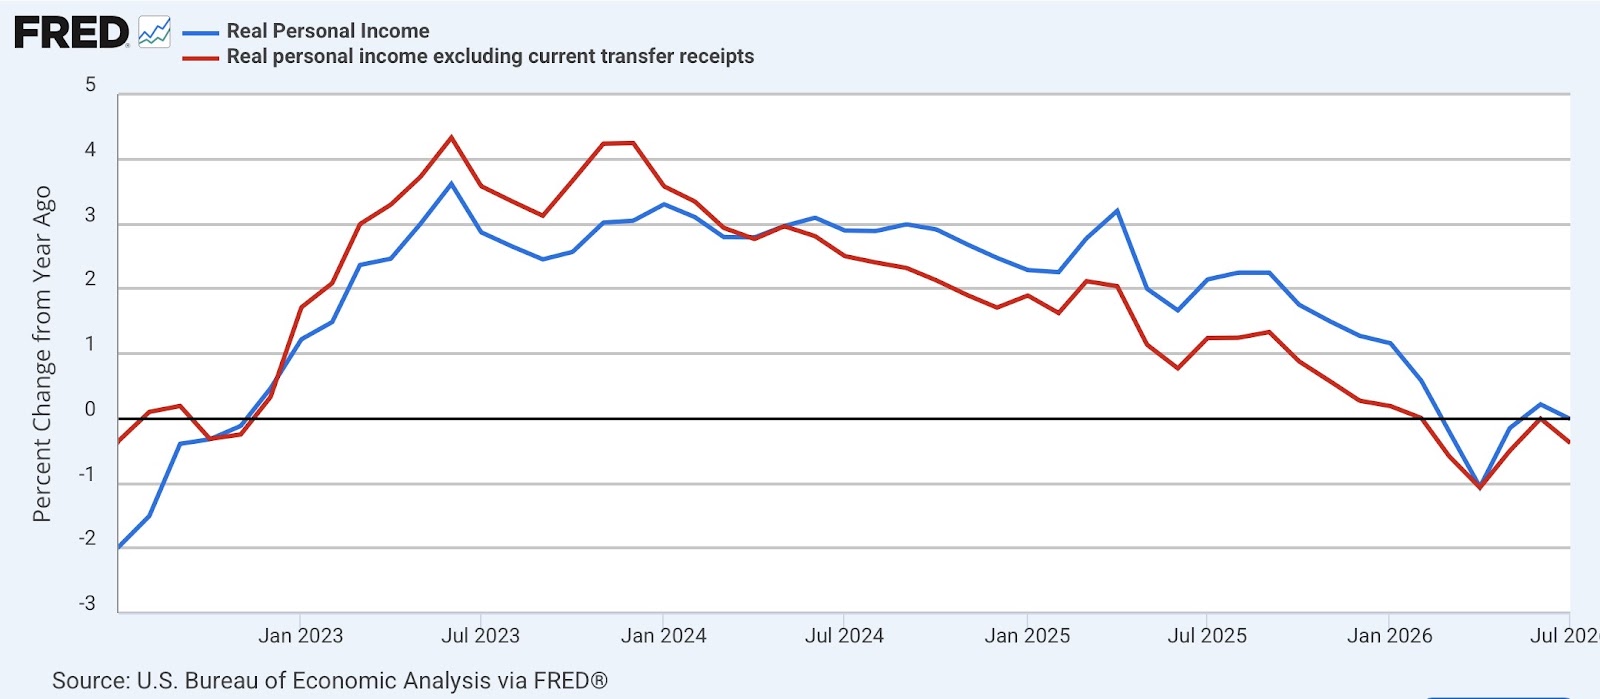
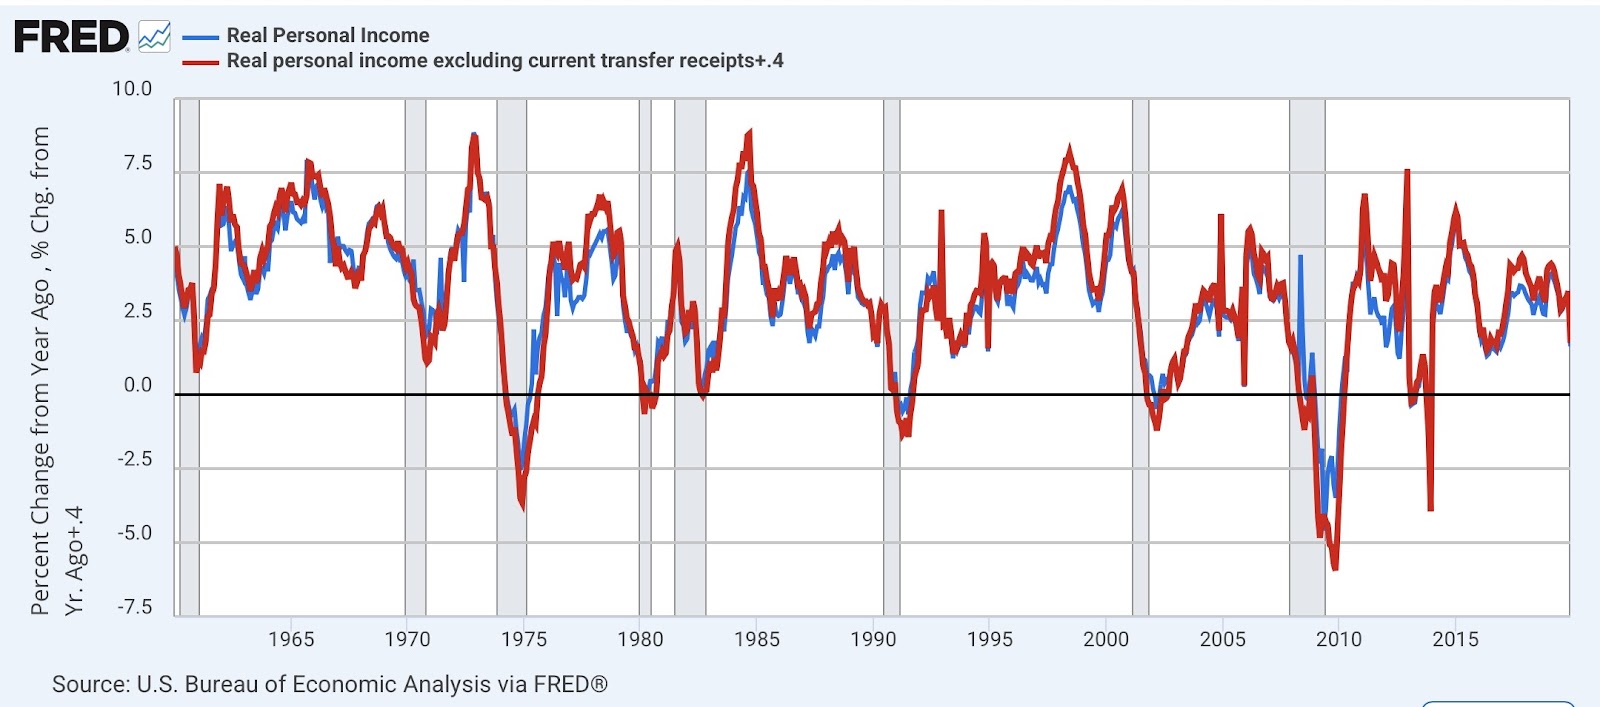
As I’ve pointed out in the past few months, this historically has been recessionary. Here is the historical graph of both, showing that current YoY levels have with the exception of 2013 (when a Social Security payroll tax holiday ended) and 2022, this has always been recessionary:
Real spending:
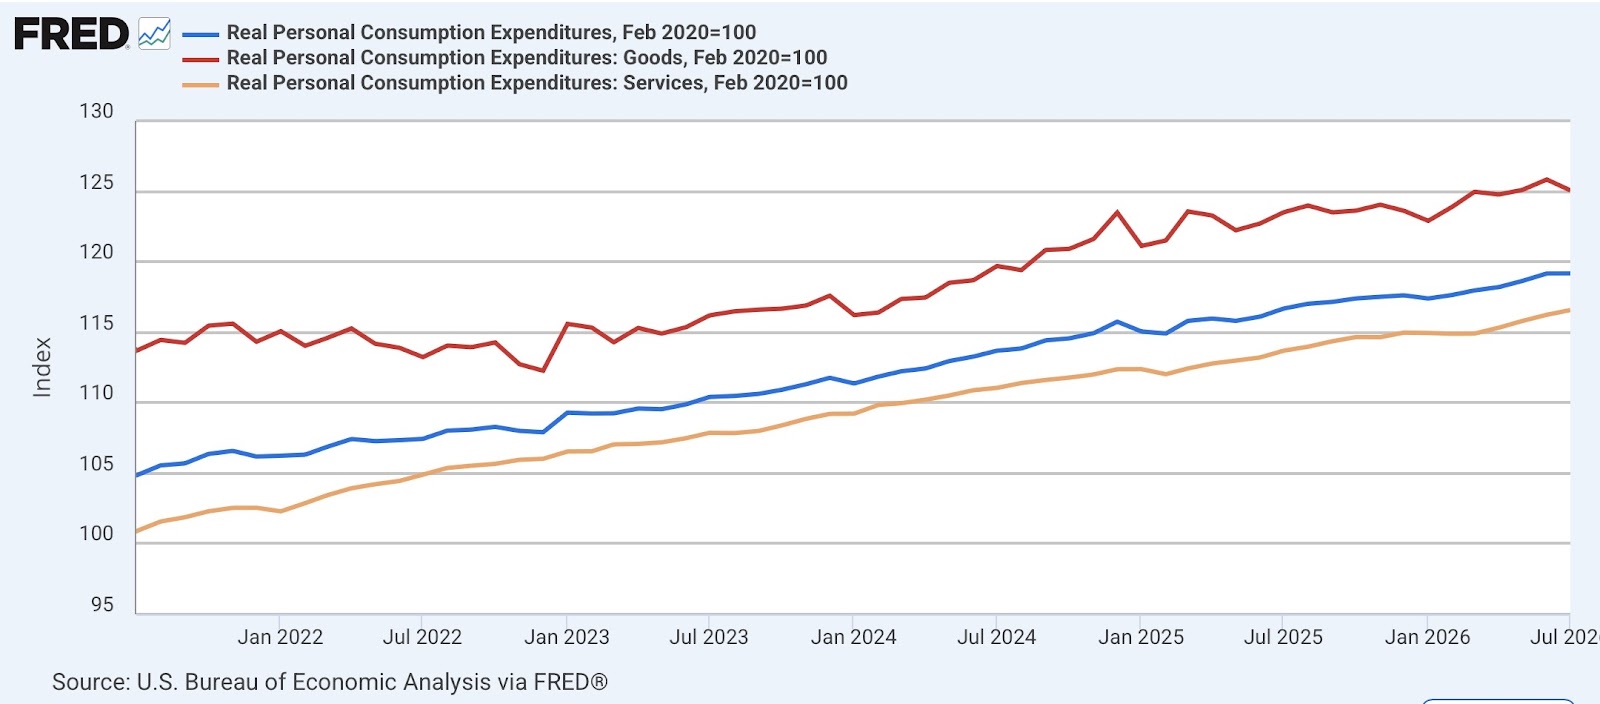
But while the income side of the ledger is poor, the spending side remains decent. Nominally, spending rose 0.2% and was up 5.9% YoY, but in real terms (blue) was unchanged for the month, but up 2.1% YoY. As I’ve noted many times in the past, the leading indicator in this data has to do with spending on goods (red), as real spending on services (gold) frequently increases all the way through recessions. In July, real spending on goods declined a sharp -0.6%, but was higher 1.3% YoY, while real spending on services increased 0.3% for the month and is up 2.5% YoY. As you can see, the trend in all three continues to be higher this year compared with last year:
Real spending on durable goods historically tends to peak even before goods spending as a whole. As shown in the graph below, real spending on durable goods (blue) declined a sharp -1.4% in July, while real spending on nondurable goods (gold) rose 0.3%:
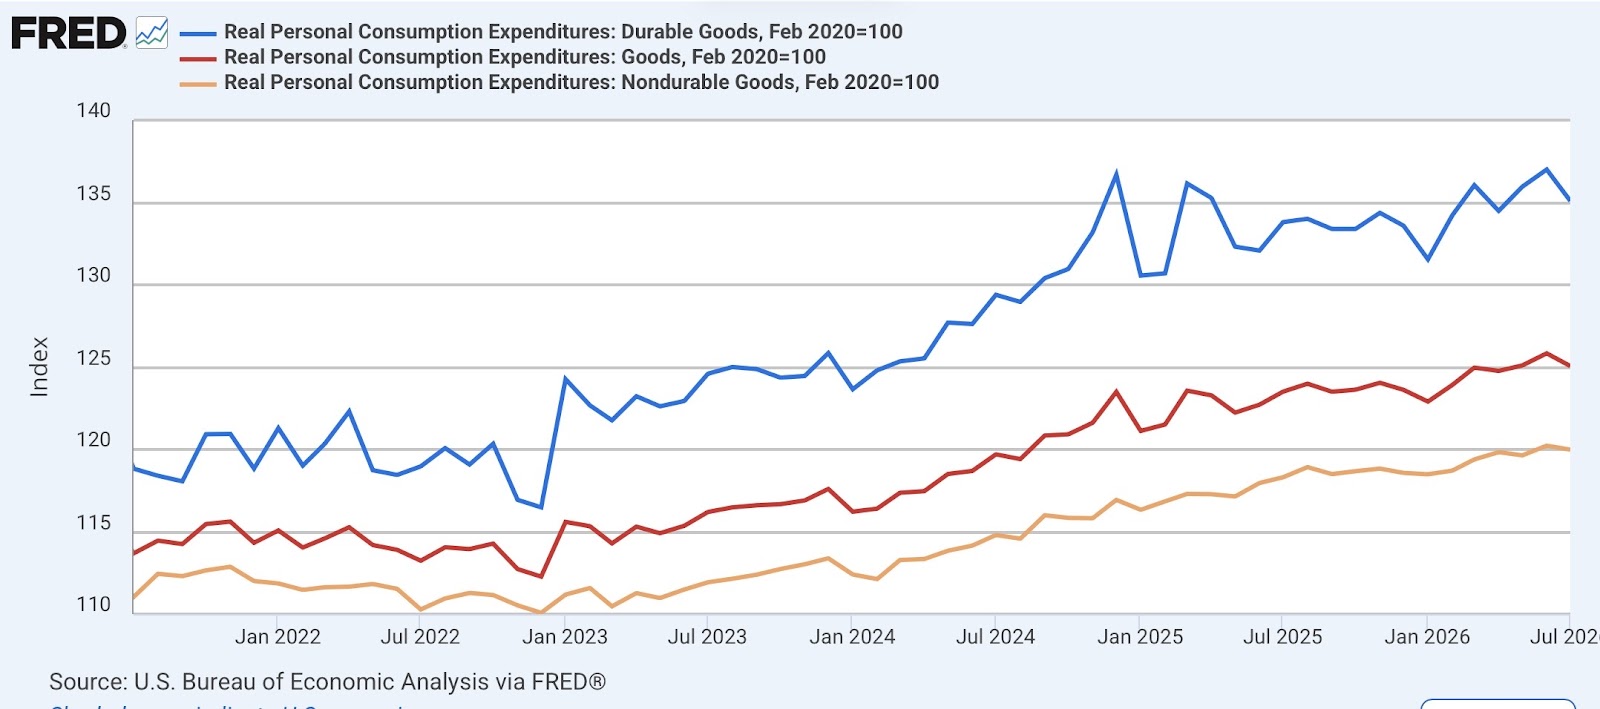
Again, the trend this year vs. last year is higher. On a YoY% basis (not shown), real spending on durable goods was higher 1.0%, and on nondurable goods higher 1.4%.
Savings, real sales, and profits:
The difference between income and spending is what is saved. And in July, the saving rate increased 0.4% to 3.0%, still very low historically. Only the era of the housing bubble and in 2022 were lower:
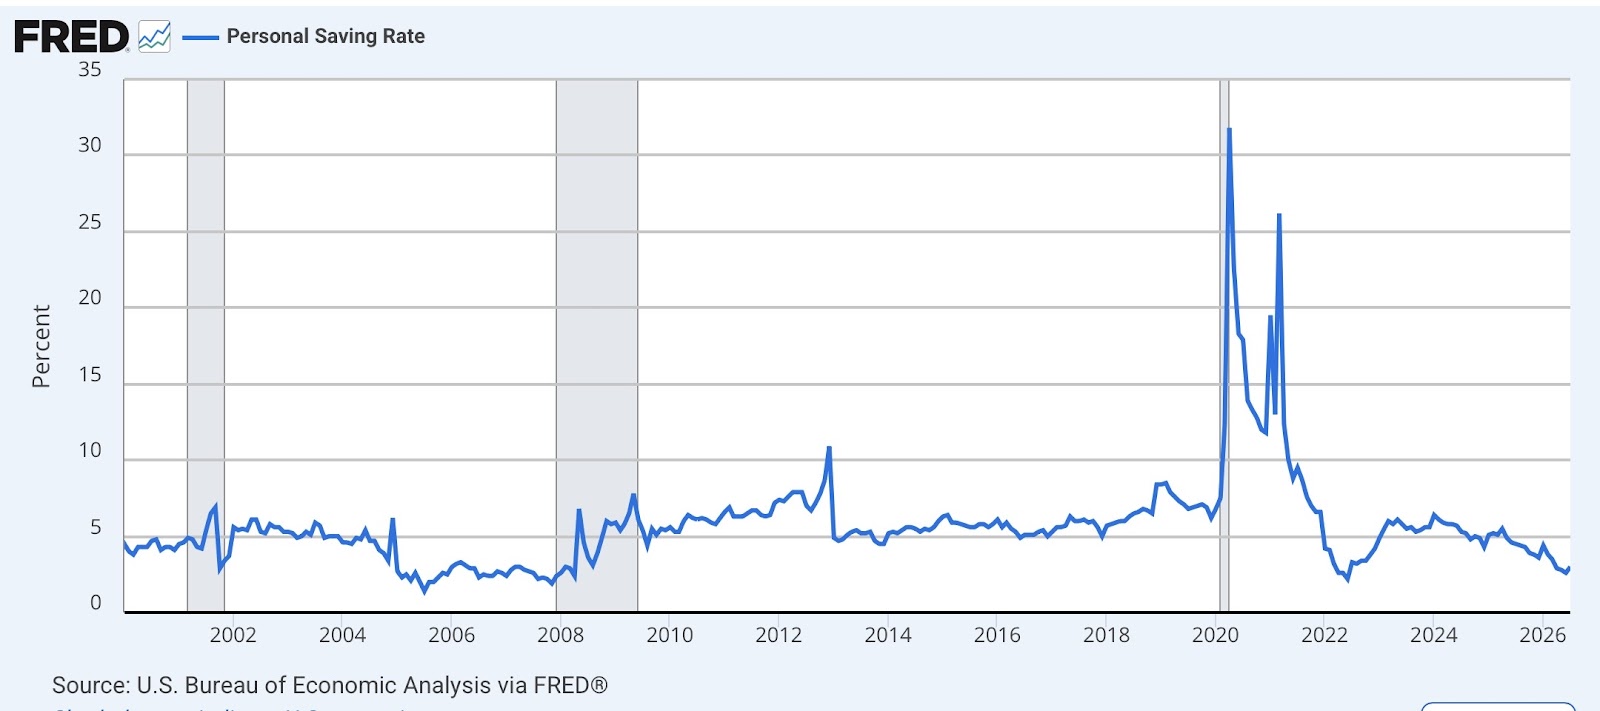
One month could easily just be noise. Or possibly it could mark the beginning of a consumer retrenchment due to the durability of higher inflation. The former would be unimportant, while the latter could mark the very near onset of a consumer recession.
Finally, this morning’s report also enables the update of real manufacturing and trade sales, one of the other important coincident markers used by the NBER to date recessions. They increased 0.3%, continuing their uptrend:
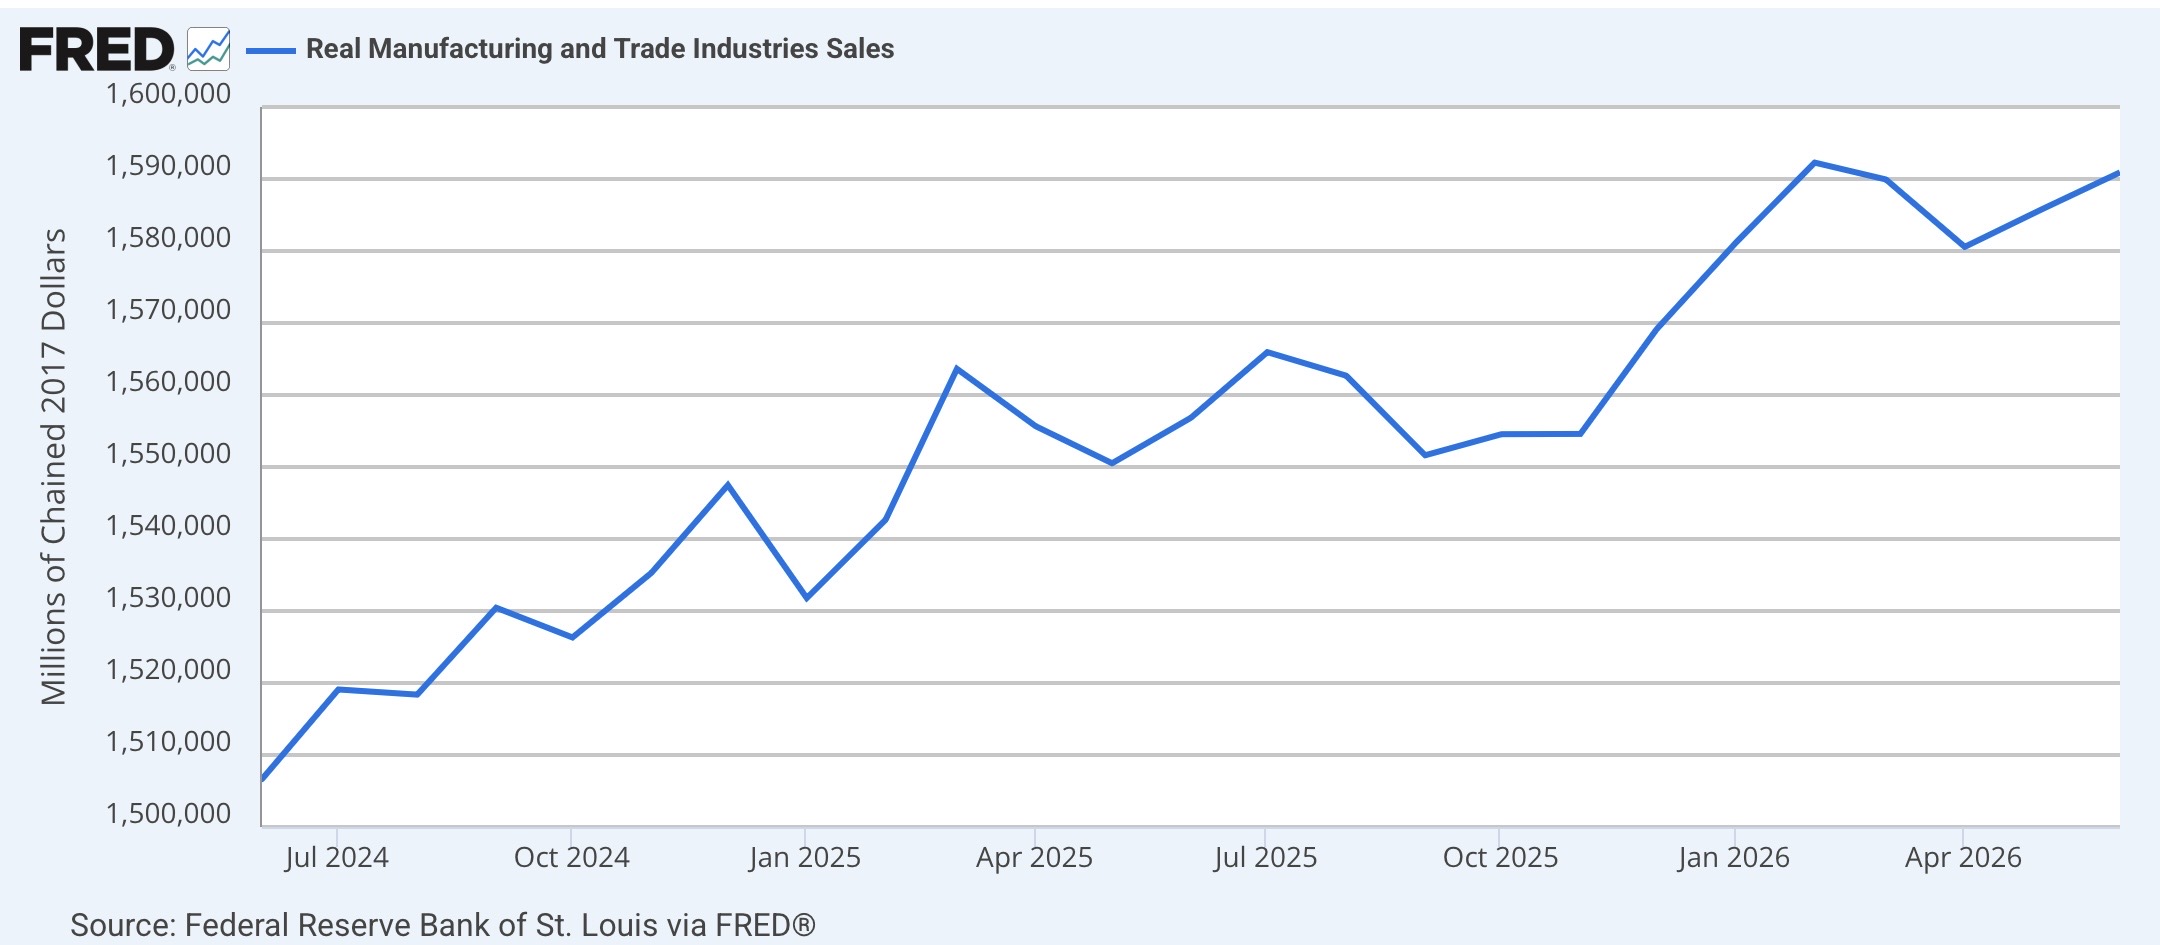
They are higher 2.2% YoY (not shown).
Concordant with that positive sales number is the rear-view mirror update of corporate profits deflated by labor costs, which was updated in this morning’s second estimate of Q2 GDP. Nominally, profits increased a sharp 8.9% in Q2 alone, and were up 28.2% YoY. Even after taking labor costs into account, they were up 8.6% for the quarter, and up 26.4% YoY. This is a simply astounding number as shown in the historical YoY% graph below:
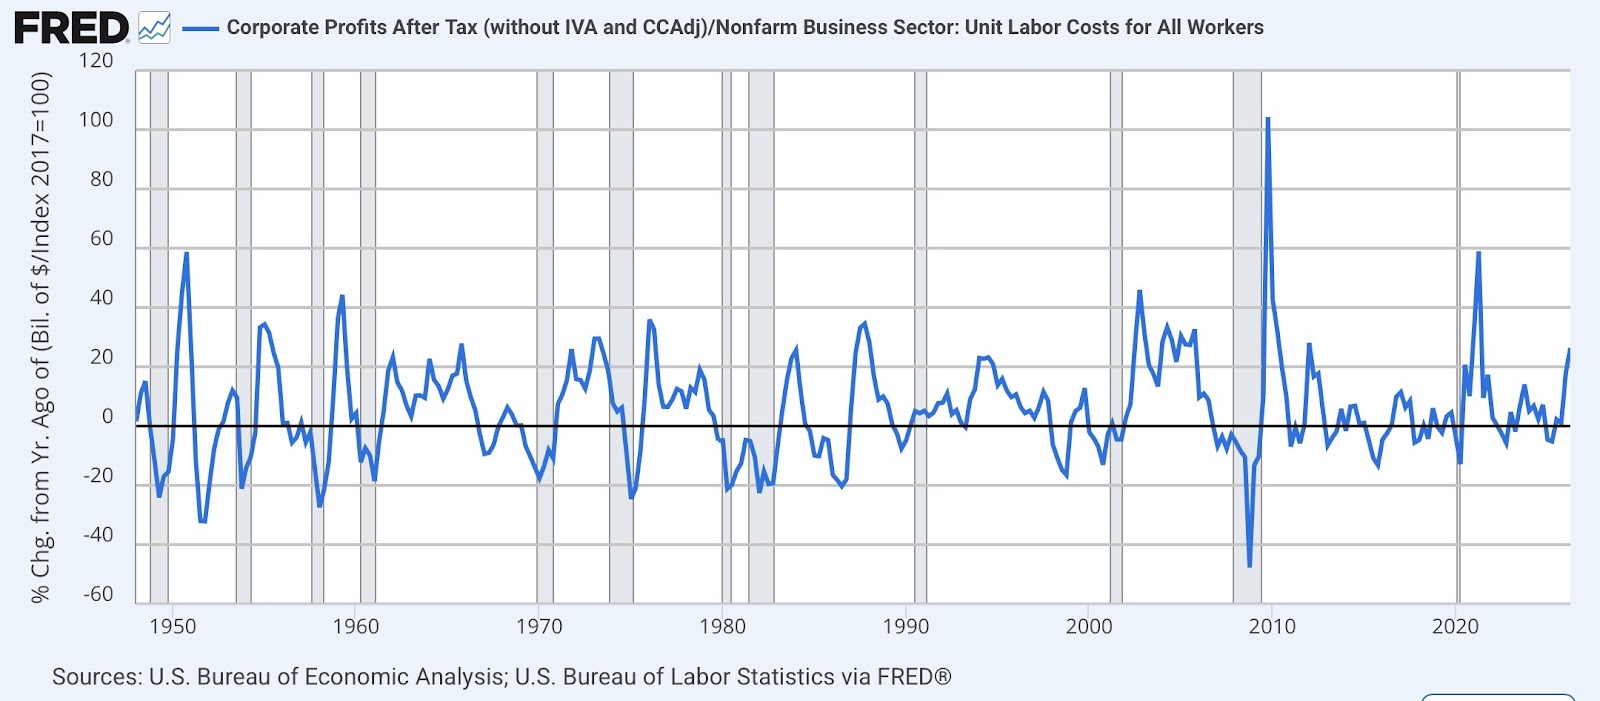
Normally such big increases only happen coming out of recessions. The exceptions were the Booms of the 1960s and 1990s, as well as after the Bush tax cuts. Likely both the tax cuts in the Big Billionaire Bust-Out Bill, as well as windfall profits in the energy sector, have played important roles here.
To sum up, this morning’s report on income and spending, as well as the sales and corporate profits reports, reinforces the picture of a consumer sector where lower-income households that do not have stock holdings are suffering, while the uppermost income tiers who own soaring stocks are continuing to hold up the spending part of the equation. I expect this situation to resolve in the very near future. Either incomes will pick up, or spending will falter if and when stock prices do.



Comments
Log in or sign up to join the conversation.