

If you do not understand the “negative wealth effect” now, wait a little while and you will!
These Charts Show the Wealth Devastation To U.S. Investors From Wall Street’s Unchecked Corrupt Practices
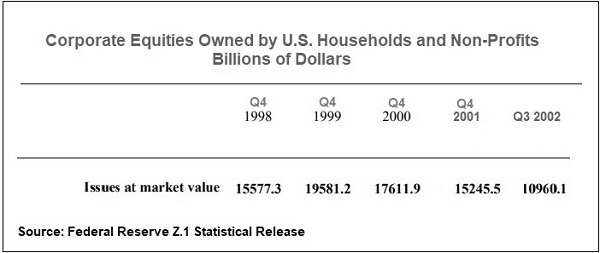
According to the Federal Reserve’s Z.1 Statistical Releases, as of December 31, 1996 the market value of stocks (“corporate equities”) held by U.S. households and U.S. nonprofits stood at $10.255 trillion. As the dot.com bubble mushroomed, by December 31, 1999 that figure stood at $19.58 trillion.
By the time all of the fraudulent research that went into listing and promoting stocks came to light, household and nonprofit wealth had shrunk by $8.6 trillion. From the end of Q4 1999 to the end of Q3 2002, the market value of household and nonprofit holdings went from $19.5812 trillion to $10.9601 trillion.
Continue reading here.



Comments
Log in or sign up to join the conversation.