

Good Monday morning and welcome back to the land of blinking screens. Russia, Trump’s Tweets as well as his latest hiring/firing, a big M&A deal, and North Korea’s latest missile tests are in focus to start the week.
But since it’s the start of a new week, let’s focus on our objective review the key market models and indicators and see where things stand. To review, the primary goal of this weekly exercise is to remove any subjective notions one might have in an effort to stay in line with what “is” happening in the markets.
The State of the Trend
We start each week with a look at the “state of the trend.” These indicators are designed to give us a feel for the overall health of the current short- and intermediate-term trend models.
(Click on image to enlarge)

Executive Summary:
- After a week of sideways price action, the Short-Term Trend Model has lost a bit of its luster – but remains modestly positive going into the new week
- Both the short- and intermediate-term Channel Breakout Systems remain on buy signals. A close below 2450 would put the short-term system at risk.
- The intermediate-term Trend Model remains solidly positive
- The long-term Trend Model is also in good shape and solidly bullish
- The Cycle Composite suggests this week will be the bulls last gasp before a meaningful decline begins.
- All 3 Trading Mode models confirm that we are now in a “trending” environment. However, none of the model readings are strong at this time.
The State of Internal Momentum
Next up are the momentum indicators, which are designed to tell us whether there is any “oomph” behind the current trend…
(Click on image to enlarge)
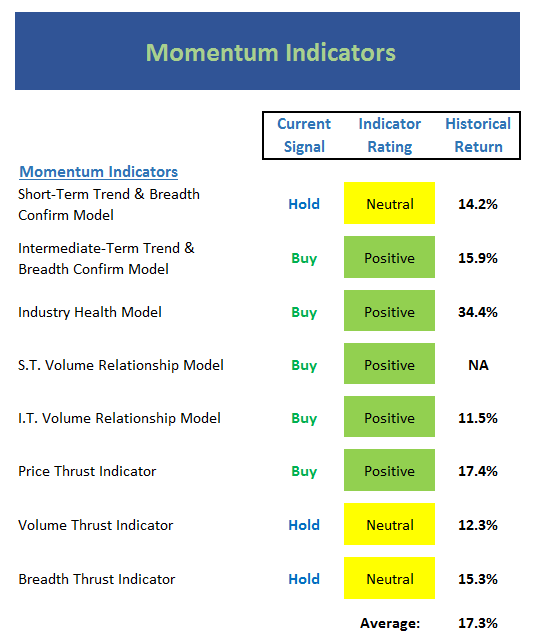
Executive Summary:
- The short-term Trend and Breadth Confirm Model slipped to neutral last week. Note that the momentum indicators have not been robust in quite some time.
- Our intermediate-term Trend and Breadth Confirm Model remains positive.
- The Industry Health Model moved up into the positive zone (albeit by the skinniest of margins) where returns have historically been very strong.
- The short-term Volume Relationship is technically positive. However, the trend of the model is not heading in the right direction.
- The intermediate-term Volume Relationship continues to be solid.
- The Price Thrust Indicator is positive
- The Volume Thrust Indicator remains stuck in neutral. This suggests the sloppy action could continue.
- The Breadth Thrust Indicator is also in the neutral zone. In short, the bulls need these “thrust” indicators to turn green to have any hope of moving much higher.
The State of the “Trade”
We also focus each week on the “early warning” board, which is designed to indicate when traders may start to “go the other way” — for a trade.
(Click on image to enlarge)
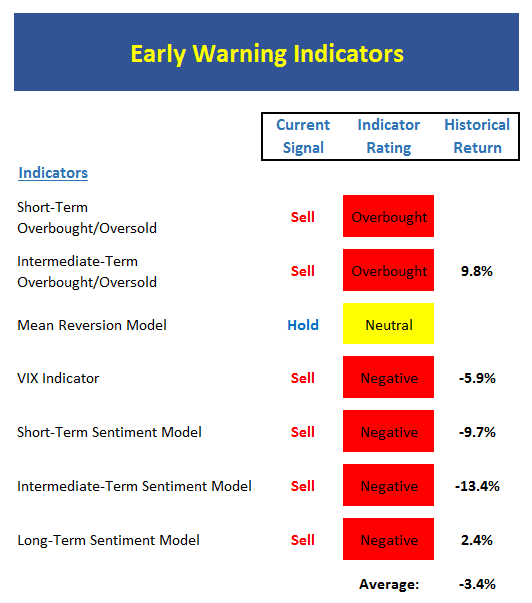
Executive Summary:
- From a near-term perspective, stocks are overbought. This is a clear warning sign.
- From an intermediate-term view, stocks are also overbought. Remember that the biggest moves in the stock market come when the “stars are aligned” in this arena.
- The Mean Reversion Model stays neutral.
- The VIX Indicators are waving warning flags. However, bulls suggest we are in a new era in terms of the VIX readings.
- Since 2006, there has only been one lower sentiment model reading. Can you say “complacency?”
- The intermediate-term Sentiment Model is negative.
- Longer-term Sentiment readings are extremely negative.
The State of the Macro Picture
Now let’s move on to the market’s “external factors” – the indicators designed to tell us the state of the big-picture market drivers including monetary conditions, the economy, inflation, and valuations.
(Click on image to enlarge)

Executive Summary:
- Absolute Monetary conditions moved back up into the moderately positive zone this week.
- On a relative Monetary Model remains at the high end of neutral. Note that the monetary models have shown consistent improvement over the last few months – a positive.
- Our Economic Model (designed to call the stock market) remains moderately positive and on a buy signal.
- The Inflation Model continues to move lower within the neutral zone. It is worth noting that our longer-term inflation model is now neutral, suggesting the Fed may not have the cover it needs to raise rates much higher.
- Our Relative Valuation Model is stuck in neutral – something the bulls continue to hang their hats on.
- The Absolute Valuation Model has improved a wee bit – but continues to suggest stocks are VERY overvalued by traditional metrics.
The State of the Big-Picture Market Models
Finally, let’s review our favorite big-picture market models, which are designed to tell us which team is in control of the prevailing major trend.
(Click on image to enlarge)
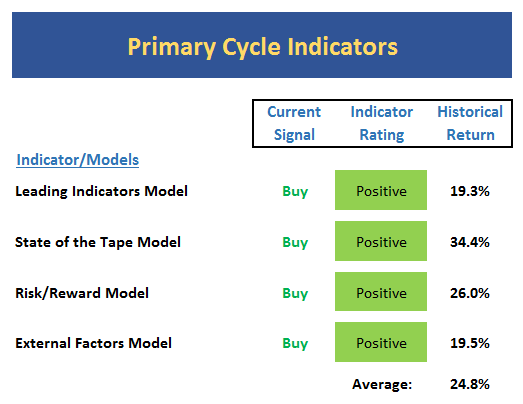
Executive Summary:
- The Leading Indicators model, which was our best performing timing model during the last cycle, has moved back to a solid reading of 80%.
- The Tape has improved to positive – by the slimmest of margins.
- The Risk/Reward model moved back into the positive zone last week. But, again, by only by a smidge.
- The External Factors model also moved back up into the positive zone – but… well… you get the idea.
The Takeaway…
It is important to note that several of my favorite models moved up into positive territory this week. In fact, the models designed to call the “Primary Cycle” of the stock market are now universally green, which can only be interpreted as a bullish sign. However, it is also important to recognize that the models are only slightly above the lines of demarcation between neutral and positive. Thus, I would keep the champagne on ice for the time being and wait for some confirmation before getting too excited. Especially with the cycle composites only a week or so away from turning down hard for several months. The bottom line is that conditions have improved but this is no time to let your guard down.
Thought For The Day:
Better three hours too soon than a minute too late. – William Shakespeare
Current Market Drivers
We strive to identify the driving forces behind the market action on a daily basis. The thinking is that if we can both identify and understand why stocks are doing what they are doing on a short-term basis; we are not likely to be surprised/blind-sided by a big move. Listed below are what we believe to be the driving forces of the current market (Listed in order of importance).
1. The State of the U.S. Economic Growth (Fast enough to justify valuations?)
2. The State of Earnings Growth
3. The State of Trump Administration Policies
4. The State of the Fed



Comments
Log in or sign up to join the conversation.