
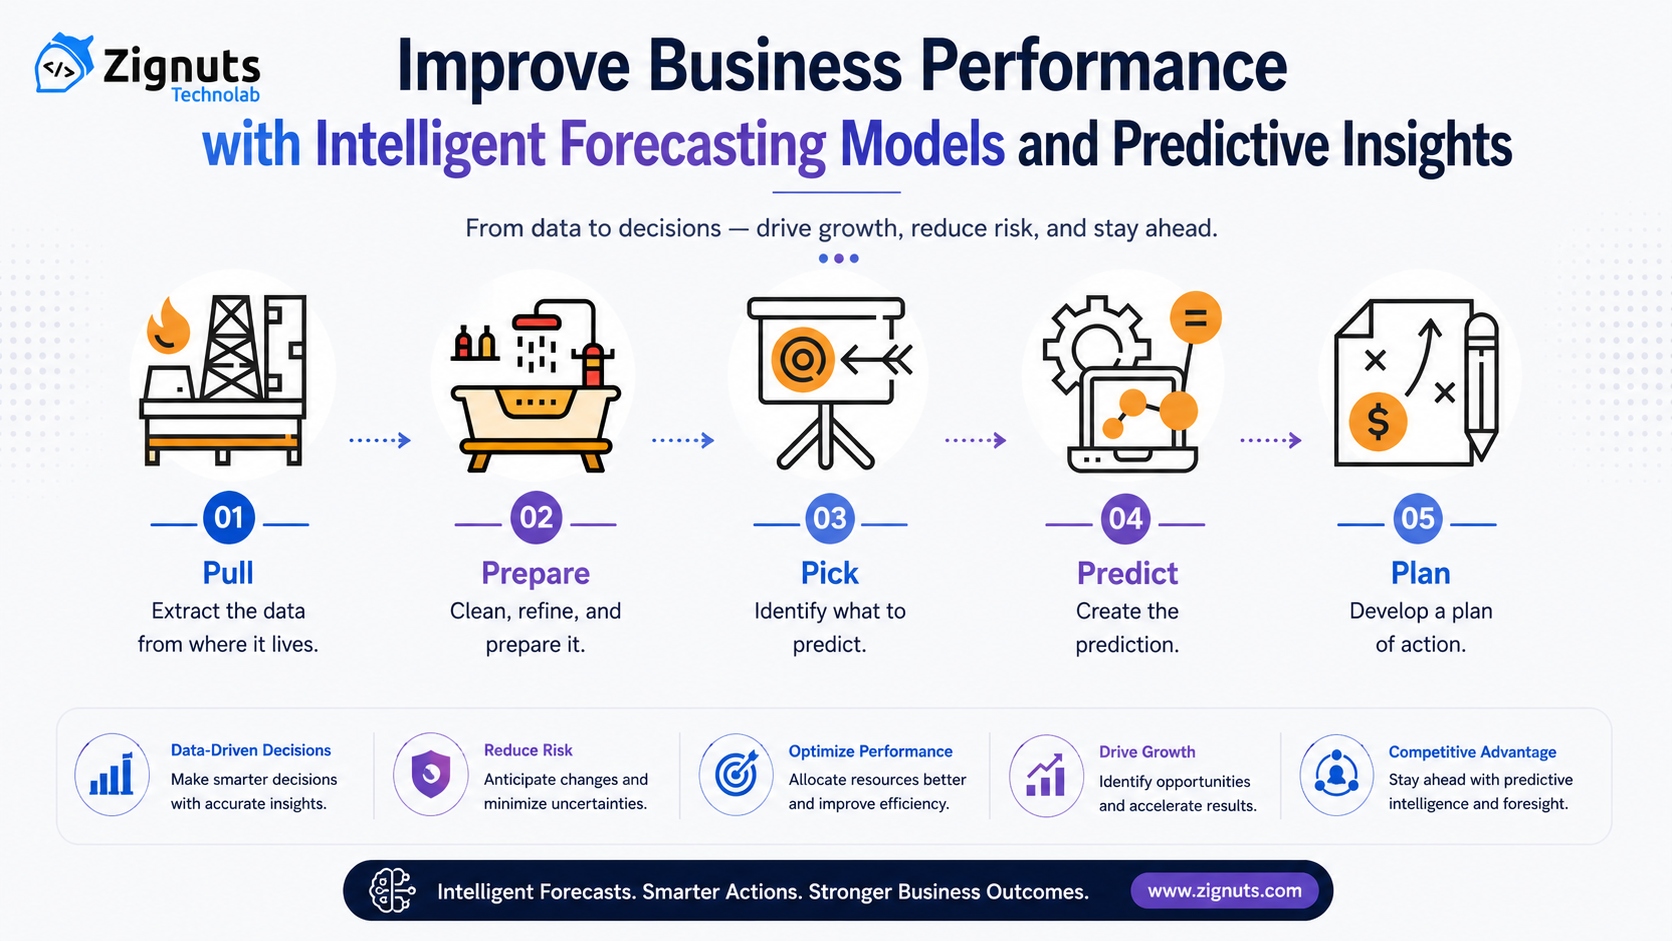
Relying on historic averages to project upcoming customer demand is the operational equivalent of driving a cargo truck by peering exclusively into the side mirrors. Yet, this remains the primary planning mechanism for the vast majority of enterprise companies. Executive leadership teams often celebrate elegant spreadsheets compiled at the end of every operational cycle, confusing the safe management of old accounting files with an actual strategic control over future margins. The reality is that an immaculate history of last year's inventory shortage provides no protection against next month's market shifts.
The fundamental error in traditional digital transformation roadmaps was building static systems designed for data preservation rather than calculation speed. Organizations invested heavily in building expansive data warehouses to capture every raw shipping notice and transactional invoice, yet they left that raw data sitting passively inside fragmented ledgers. Analytical professionals spent the majority of their time preparing old rows of text rather than running multi-variable market simulations.
True industry disruptors recognize that reacting to market patterns after they show up on financial reports is an existential business risk. By deploying advanced intelligent forecasting models, forward-looking organizations are transforming passive corporate record vaults into real-time decision engines. They are moving past basic descriptive metrics to equip their business networks with the capability to anticipate demand fluctuations, optimize working capital allocations, and securely capture premium market opportunities before competitors register a change in environment.
Industry Context: Compounding Vulnerabilities in Static Markets
The current macroeconomic landscape leaves no margin for delayed responses. Severe supply network constraints, radical shifts in consumer purchasing behavior, and unpredictable variations in baseline energy and raw material costs are punishing enterprises stuck in slow planning tempos. To insulate the corporate margin, digital transformation teams must move at a faster pace than the market itself.
Concurrently, the foundational data processing landscape has entered a highly practical phase of development. Advanced automated processing scripts and distributed pattern-matching mathematical models are now accessible as standard cloud utilities. Modern enterprise infrastructure possesses the computational capability to analyze hundreds of localized variables concurrently, pushing high-fidelity predictive insights straight to operational managers.
This technological shift directly impacts competitive survival. Organizations can no longer defend market share while running on human gut feelings or periodic static calculations that require weeks of human assembly. Thriving in the current environment demands automated systems that actively parse current performance signals, contrast them against global historical baseline trends, and surface accurate forecasts exactly when capital needs to be deployed.
Why Traditional Thinking Falls Short
The primary reason ambitious analytical initiatives fail to scale is the outdated corporate assumption that past data patterns will naturally repeat in clean, predictable cycles. For decades, executive teams treated market demand as a linear equation, assuming that adding a basic percentage increase to last year's sales figures qualified as a functional business strategy.
This old operational approach creates severe systemic vulnerabilities:
Isolated Functional Data Silos: Inventory systems run completely separated from client support trackers, preventing real-time satisfaction issues from adjusting immediate manufacturing levels.
Stagnant Corporate Decision Cycles: Because standard planning frameworks look backward, critical shifts in customer demand are discovered long after they hit the bottom line.
Severe Constraints on Scalability: Depending on manual spreadsheet models to manipulate massive operational variables introduces human errors and produces major workflow variances across regional offices.
Demanding perfect operational data across all global offices before activating automated predictive tools is a massive error. Your internal logs, legacy system records, and warehouse metrics will never be completely clean. The path to achieving sustainable revenue expansion requires integrating resilient statistical tools that extract clear operational trends from messy data, unlocking clear balance sheet value from the very first deployment phase.
Modern Business Strategy: Transitioning to Algorithmic Decision Celerity
Moving past simple historical tracking requires a complete shift in how enterprise leadership groups value corporate data. Instead of functioning as an archive of completed actions, data infrastructure must operate as a live feedback mechanism that actively drives day-to-day operations.
When connected to modern decision intelligence frameworks, intelligent tools completely reshape how organizations approach capacity optimization and customer life cycles. Rather than waiting for a regional fulfillment site to run out of inventory or an industrial machine to suffer a breakdown, an operational architecture built on intelligent forecasting models monitors system data, links active behavioral shifts against macroeconomic indicators, and automatically routes freight allocations or maintenance crews before an asset failure occurs.
This capacity changes raw metrics into clear strategic advantages. By assigning high-frequency pattern matching to automated software, corporate operators eliminate planning bottlenecks, optimize multi-site asset returns, and position their workforce to focus exclusively on highly creative market innovation.
The AI Value Stack Framework
To successfully convert disconnected historical data into verified bottom-line margins, companies must follow a structured execution architecture. The AI Value Stack outlines exactly how technical inputs are refined into real business value.
             ┌─────────────────────┐
             │   Business Impact   │
             └──────────▲──────────┘
                        │
             ┌─────────────────────┐
             │ Intelligent Actions │
             └──────────▲──────────┘
                        │
             ┌─────────────────────┐
             │ AI Reasoning Layer  │
             └──────────▲──────────┘
                        │
             ┌─────────────────────┐
             │ Data & Knowledge    │
             └──────────▲──────────┘
                        │
             ┌─────────────────────┐
             │ Business Processes  │
             └─────────────────────┘
Business Processes
The absolute base of the corporate execution layer, representing the digital and physical environments where day-to-day operations occur, such as automated manufacturing lines, corporate banking ledgers, clinic portals, or digital storefront networks.
Data & Knowledge
The foundational storage layer where scattered corporate signals are compiled, including live streaming event logs, historical transaction books, inventory levels, and external market pricing histories.
AI Reasoning Layer
The analytical core of the stack. Here, statistical models and machine learning frameworks read across historical information strings to isolate hidden patterns, map mathematical correlations, and formulate accurate forecasts.
Intelligent Actions
The deployment layer where system recommendations turn into direct real-world interventions, such as adjusting live commodity buying structures, altering freight logistics routes, or shifting regional labor allocations.
Business Impact
The peak of the architecture, representing true structural improvements visibility on corporate balance sheets, including minimized product scrap waste, lowered customer churn rates, and maximized operating margins.
Real-World Applications Across Industries
Retail: Anticipatory Demand Curation Across Complex Distribution Networks
Business Problem: A multi-region consumer goods retailer lost millions in potential revenue because standard historic models failed to predict sudden regional shifts in food item preferences, causing simultaneous stock surpluses and shortages.
Technology Approach: The logistics team deployed an intelligent forecasting models engine that analyzes local social indicators, sudden regional weather variations, and real-time point-of-sale data to dynamically route stock.
Implementation Challenge: Aligning high-frequency digital app clickstreams with legacy mainframes running older inventory logs.
Measurable Business Outcome: Out-of-stock occurrences dropped by 34 percent, helping drive a structural 19 percent reduction in total warehouse storage expenses.
Finance: Automated Corporate Cash Flow Risk Mitigation
Business Problem: A commercial financial services institution saw credit losses rise because standard risk tracking systems failed to isolate deteriorating liquidity positions within mid-market accounts early enough.
Technology Approach: The risk management team built automated predictive tools that review daily invoice cycles, supplier transaction velocity, and broader macroeconomic pricing variables to calculate risk levels.
Implementation Challenge: Normalizing messy, unstructured transaction data fields pulled from dozens of separate client accounting platforms.
Measurable Business Outcome: Portfolio loan defaults fell by 27 percent within twelve months, permitting the bank to safely lower its corporate capital reserve requirements.
Healthcare: Dynamic Patient Admission and Capacity Optimization
Business Problem: An urban multi-site hospital group suffered from extreme emergency department overcrowding and nurse staffing mismatches due to unexpected weekly spikes in patient admissions.
Technology Approach: The operations department implemented an intelligent predictive system that reads localized epidemiological tracking data, regional accident frequencies, and historical weather cycles to project patient arrivals 72 hours out.
Implementation Challenge: Maintaining absolute data privacy and governance controls by ensuring all model calculations occur on completely anonymized records.
Measurable Business Outcome: Patient wait times dropped by 28 percent, while clinical labor efficiency scores improved, saving 1.8 million dollars in annual operating overhead.
Manufacturing: Prescriptive Factory Component Failure Prevention
Business Problem: A heavy industrial equipment builder experienced frequent, unplanned assembly line shutdowns because critical hydraulic components failed unexpectedly, causing severe downstream distribution bottlenecks.
Technology Approach: The plant floor integrated real-time vibration sensors directly onto the production tools, routing the telemetry into automated machine learning frameworks that predict component degradation.
Implementation Challenge: Teaching the software algorithms to separate true component degradation signatures from standard baseline tool adjustments and operational heat noise.
Measurable Business Outcome: Unplanned factory floor shutdowns decreased by 41 percent, expanding equipment lifecycles and protecting high-value manufacturing margins.
Strategic Decisions and Business Value Matrices
Evaluating advanced analytical investments requires a methodical approach that contrasts immediate technical capabilities against long-term operational impact.
Business Value Matrix
Business Capability | AI Readiness | Expected Business Value | Implementation Difficulty | Priority |
Predictive Logistics Routing | High | High (Lowers inventory overhead and eliminates stockouts) | Medium (Requires connecting ERP and distribution tools) | Immediate |
Automated Capital Optimization | High | High (Directly lowers portfolio credit default losses) | Low (Leverages existing financial database logs) | High |
Prescriptive Machine Alerting | High | High (Prevents catastrophic factory floor delays) | High (Requires site IoT sensors and edge computing tools) | High |
Dynamic Portfolio Value Pricing | Medium | Medium (Optimizes transaction margin capture thresholds) | High (Requires strict automated pricing guardrails) | Medium |
Automated Vendor Lead Profiling | High | Medium (Reduces corporate procurement management steps) | Low (Clean API linkages with existing procurement portals) | Quick Win |
Executive Decision Matrix
Decision Area | Questions Leaders Should Ask | Risk if Ignored | Success Indicator |
Strategic Bottleneck Focus | Does this analytics pilot target a distinct financial bottleneck, or are we just experimenting with new software capabilities? | Wasted development capital; broad internal skepticism regarding future digital transformation initiatives. | A verified improvement in process cycle times or unit margins within 90 days. |
Data Governance Security | How will our predictive engines process real-time customer data while maintaining strict global privacy compliance? | Severe legal compliance penalties; permanent loss of consumer trust following an internal database error. | Full compliance certification from corporate risk officers, validated by regular independent audits. |
System Integration Path | Can this forecasting platform ingest data directly from legacy systems without manual engineering work? | Over-budget project rollouts; years of developmental delay that make the software obsolete before launch. | Seamless automated ingestion of over 85 percent of targeted enterprise data within the initial pilot. |
Frontline Team Engagement | Have we designed our workflows so operators treat automated insights as an asset rather than a tracking tool? | Low tool utilization; staff bypassing automated models to return to legacy intuition-based processes. | Over 80 percent of system-generated recommendations accepted and executed by operations teams. |
Quantifying the Structural Benefits of Algorithmic Foresight
Deploying self-correcting statistical engines deep within enterprise networks introduces major structural efficiencies that improve corporate profitability.
Significant Reductions in Manual Administrative Overhead
By removing manual spreadsheet assembly work and replacing it with continuous data computation, companies free their staff from repetitive tasks. Humans are highly creative, but they introduce natural cognitive biases and mathematical mistakes when handling thousands of line items by hand. Turning forecasting tasks over to software models lets an enterprise scale its planning actions without increasing administrative headcount.
Accelerated Enterprise Decision Velocity
In hyper-competitive global business environments, reaction speed determines survival. Companies that take weeks to isolate a demand reduction shift, identify an inventory bottleneck, or recognize a financial credit risk drop lose significant revenue to nimble competitors. Modern analytics platforms evaluate information deviations instantly, empowering operational managers to shift product runs, reallocate capital, or launch targeted outreach in minutes.
Absolute Operational and Quality Consistency
Automated predictive models run continuous, unblinking checks across corporate operational pathways. This constant system oversight ensures that internal process executions, capital flows, and logistics movements match corporate rule books and current compliance goals, eliminating the expensive errors that occur during manual data manipulation.
Navigating the Challenges of Enterprise Analytics Implementations
While the strategic value of deploying algorithmic forecasting tools is definitive, technology leaders must plan for clear implementation hurdles.
              ┌──────────────────────────────────────────────┐
              │            Analytics Deployment Barriers     │
              └──────┬───────────────┬───────────────┬───────┘
                     │               │               │
        ┌────────────▼────┐   ┌──────▼─────┐   ┌─────▼──────────┐
        │ Data            │   │ Legacy     │   │ Cultural       │
        │ Fragmentation   │   │ Friction   │   │ Hesitancy      │
        └─────────────────┘   └────────────┘   └────────────────┘
Overcoming Internal Data Quality Fragmentation
Large corporations naturally generate files across dozens of separate, disconnected legacy applications. Varied database formats, empty data fields, and irregular tracking histories produce messy inputs that can confuse basic statistical tools.
Mitigation Strategy: Focus data cleaning tasks strictly on the precise ingestion pipelines required for your highest-priority pilot project, rather than delaying development to build a massive global warehouse first.
Managing Legacy Infrastructure Integration Complexity
Connecting modern machine learning prediction software to old, decades-old core software networks can create development friction, high custom engineering bills, and systemic stability issues.
Mitigation Strategy: Construct secure intermediate API microservices and clear abstraction layers that let the forecasting tools extract data without altering the structural integrity of your core applications.
Overcoming Internal Cultural Hesitancy and Skepticism
Frontline managers and field staff frequently ignore algorithmic suggestions, choosing instead to rely on personal intuition and gut feelings built up over decades in the field.
Mitigation Strategy: Launch the initiative with absolute transparency. Openly show your operations teams exactly how the algorithms find patterns, and position the platform as a helpful tactical co-pilot built to protect their time.
Executive Best Practices for Implementation
To secure maximum returns on advanced analytical investments, technology decision-makers should execute a deliberate, value-first deployment roadmap.
Tie Every Initiative to a Specific Line Item on the Balance Sheet: Never greenlight an analytics project out of curiosity or a vague desire to chase industry trends. Focus exclusively on a documented operational bottleneck where manual forecasting restricts daily yield.
Fix and Streamline the Chosen Data Stream First: Do not attempt to fix all your enterprise databases simultaneously. Isolate the precise data channels needed for your immediate high-value initiative, and clean that single line completely.
Form Agile Cross-Functional Development Teams: Avoid building data models inside an isolated tech lab. Form agile groups that blend advanced data engineering capabilities with the ground-level experience of field operations leads.
Establish Clear, Audit-Ready Performance Metrics: Quantify your exact component scrap percentages, process turnaround speeds, and manual labor expenses before activating the software, ensuring a solid baseline to prove long-term value.
Frequently Asked Questions
What exactly are intelligent forecasting models and how do they build corporate value?
Unlike older retrospective reporting setups that only show past metrics, intelligent forecasting models combine historic business datasets, continuous machine learning logic, and streaming data points to predict upcoming market actions, helping companies capture revenue and cut resource waste early.
Why should our leadership group prioritize predictive insights today?
In an era marked by extreme supply chain volatility and tight operating margins, relying on slow monthly updates introduces massive financial risk. Scaling predictive analytics tools allows modern companies to forecast product shifts, optimize working capital, and mitigate credit risks before disruptions occur.
What are the standard development costs for an initial analytics pilot?
A single targeted project focused on a well-defined application, such as localized retail store demand forecasting, typically demands an investment between 125,000 and 285,000 dollars. Multi-department enterprise integrations scale into larger budgets that are quickly balanced by reductions in structural waste.
How do finance directors accurately evaluate the return on investment?
ROI is measured by tracking hard operational changes, including total inventory carrying costs reduced, customer acquisition cost improvements, manual administrative hours saved, and increased asset capacity achieved without hiring extra headcount.
What is a realistic timeline for a production-grade software rollout?
A focused operational pilot can usually be launched and delivering insights within nine to twelve weeks. Scaling that system into a deeply integrated architecture that interacts cleanly with your core enterprise ERP network generally takes four to eight months.
What primary mistakes must corporate leadership teams avoid during a launch?
The most damaging error is launching broad, loosely defined data projects without attaching them to a verified commercial bottleneck. Leadership teams must also avoid software platforms that lack clear data governance boundaries and ensure they do not isolate developers from frontline users.
Turning Volatility into a Competitive Asset
The boundary that separates high-margin industry leaders from struggling organizations is defined by the speed at which they turn raw data into decisive action. Storing massive historical archives without extracting forward-looking insights is an expensive real estate expense that bogs down your business velocity.
Real digital transformation requires looking past historical charts. Adopting a deliberate intelligent forecasting models blueprint allows you to eliminate manual forecasting bottlenecks, shield your organization from hidden credit and operational risks, and turn static data into your most valuable financial asset.
Take a critical look at your current technology investments. Are you merely funding an expensive digital archive of your past losses, or are you actively scaling the forward-looking systems that will own your market tomorrow?
Comments
Log in or sign up to join the conversation.