

Summary
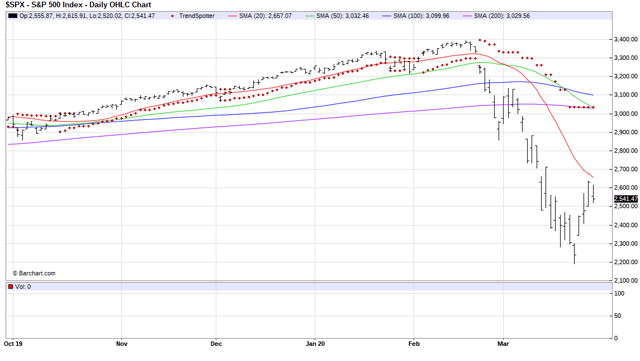
- S&P 500 peaked on 2/19 at 3,393.52.
- S&P 500 hit new bottom on 3/23 at 2,192.86.
- Today we closed at 2,541.47.
The S&P 500 Large Cap Index (SPX) is off it's recent low but is no way near its past 200 Day Moving averages sell signal at 3,023.94. For those of you who follow me on a regular basis, you know I get out of the market with a hard stop loss at the 200-day moving average and easy back in at 25% increments as we recover through the 20, 50, 100 and 150-day moving averages. We are not there yet as the chart below shows:
(Click on image to enlarge)
For those of you that want to see how the broader market is fairing and like your information in table form you should be consulting Barchart's Market Performance Indicator on it's Stock Market Momentum & Daily Stock Activity tab:
Market Performance Indicator
Barchart Market Momentum Index (BCMM) [-9.79%] is an exclusive index used as an indicator of change in overall markets. It reflects the movement of stocks who fit the following criteria: must have current SEC filings, must have traded for a minimum of 6-months, and must be trading above $2.
MARKET AVERAGE
The percentage of stocks in BCMM above their individual Moving Average per period.
| 5-Day MA | 20-Day MA | 50-Day MA | 100-Day MA | 150-Day MA | 200-Day MA | |
|---|---|---|---|---|---|---|
| Today | 71.46% | 18.75% | 4.46% | 5.85% | 7.79% | 8.85% |
| Yesterday | 93.82% | 27.71% | 5.71% | 7.04% | 9.38% | 10.74% |
| Last Week | 33.03% | 3.13% | 2.36% | 3.29% | 4.65% | 5.07% |
| Last Month | 11.22% | 7.12% | 11.40% | 20.58% | 25.63% | 28.11% |
Although things are better now than they were last week or last month they are not better than they were yesterday.
Just have patience and the market will get back to normal.


Comments
Log in or sign up to join the conversation.